
Tycho's SNR (type Ia)
Credits: NASA/CXC/SAO

Cassiopeia A (type II)
Credits: NASA/CXC/SAO
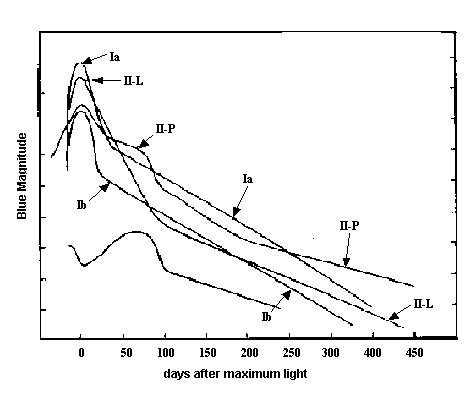
Supernova Light Curves
Purpose: To use observational data of the magnitude of a supernova event over time to classify it as Type Ia or Type II.
Background:
Some stars end their lives in a massive explosion or supernova. Supernovae are classified as Type I or Type II depending on the presence or absence of hydrogen lines in the maximum light optical spectra of the supernovae. The type of supernova can also be identified by examining the shape of its light curve (a plot of how an object's brightness changes over time). What events lead to these different types of supernovae? Let's investigate!
Tycho's SNR (type Ia) Credits: NASA/CXC/SAO |
Cassiopeia A (type II) Credits: NASA/CXC/SAO |
1. In what kind of star system does a Type Ia supernova originate? How big are these stars in the given scenario?
2. What stage does a main sequence star enter when it runs out of hydrogen?
3. In a red giant’s core, helium fuses to what element? What other element(s) can be formed?
4. When the outer layers of a red giant puff away, what remains?
5. What has to happen for a white dwarf to supernova?
6. Why can we see Type Ia supernovae halfway across the universe?
7. What happens to the white dwarf and its companion star after a Type Ia supernova?
Type II Supernova
Open NOVA Online > Runaway Universe > Birth of a Supernova > Type II
8. In the Type II supernova scenario given, how many times more massive is this star than the sun?
9. How does the lifetime of this star compare to that of the Sun?
10. What keeps a main sequence star stablized?
11. Where does the heat in a star come from?
12. In what order are elements fused in a massive star?

13. Where are these elements found in relation to the core once all have been fused? (Write the correct chemical symbols in each layer.) Are lighter or heavier elements found closer to the core?
14. Why does nuclear fusion in a star stop after iron (Fe) is formed in the core? What happens to the star then?
15. What causes the shockwave that initiates the supernova explosion?
16. How are elements heavier than iron produced?
17. What is a possible core remnant of a Type II supernova?
Making Light Curves
Adapted from the AAVSO website:
Observationally, supernovae are classified into two main types (type I and II), depending on the presence or absence of hydrogen lines in the maximum light optical spectra of the supernovae.
Type I supernovae - hydrogen lines absent
Type Ia - Defined by the absence of hydrogen lines and the presence of a Si II absorption line. Typically uniform light curves and spectra. Type Ia supernovae result from the thermonuclear runaway explosion of a white dwarf star which reaches a critical mass (1.4 solar masses, the Chandrasekhar limit) by accreting material from its binary companion.
Type Ib and Ic - Both lack hydrogen lines and the Si feature. Type Ic display weak He lines. Type Ib and Ic events are most likely to be core-collapse events in stars which have lost most of their hydrogen envelope, perhaps through Roch lobe overflow to a binary companion.
Type I supernovae - hydrogen lines present
Type II - Encompasses all supernovae with hydrogen lines. Optical light curves of this type are heterogeneous and subclassified into type II-L (the light curve falls off linearly in time) or type II-P (light curve stays at a plateau for a period of a few weeks before falling off.
Type I supernovae are typically two magnitudes brighter than Type II and decay faster. Type II explosions, usually fainter than Type I supernovae, typically show a plateau in their light curves a few months after initiation.
You will be making light curves for Supernovae 1987A and 1990N. The number in the name stands for the year the supernova was first observed. The first supernova of the year is “A”, the next “B” and so on. From observations of their changing magnitudes over time, you will then classify these supernovas as Type Ia or Type II.
Procedure for Data Analysis:
1. Open the data sets for these supernovae. Also, open an new Excel spreadsheet.
2. Highlight the first column (1990N) on the web page, and copy and paste it into column A of the spreadsheet. You should have text labels in cells A1 and A2, with the numerical data starting in A3. In the same manner, paste the second column into column B of your spreadsheet.
3. Repeat step #2 for 1987A using columns C and D.
4. You want to compare the brightness of these two supernovae, therefore you want to make a light curve of ABSOLUTE magnitude versus time (in days). You are going to make four new columns with this data. In cell E1, type “1990N”. In cell E2, type “time (days)”. In cell E3 you are going to type a formula which will subtract the first Julian day of the observations from the current Julian day to get the time passed in days. Enter this formula in E3:
=A3-$A$3
Highlight cell E3, and holding the left mouse button down, drag down to the last cell of data. Click Edit>Fill>Down. Click on cell E5 - notice that the formula reads
=A5-$A$3
The dollar signs refer to an absolute cell and will not change when the formula is filled down a column. We are always subtracting the first Julian day from the current one.
5. In cell F2, type “abs. mag.” In F3, you will enter a formula that calculates the absolute magnitude from the apparent magnitude and the distance. Let's assume the distance to 1990N has been found to be 25,500,000 pc using other data. Remember:
6. Repeat steps #4 and #5 for 1987A in columns G and H. The distance to 1987A has been found to be 50,900 pc.
7. Highlight columns E, F, G and H using your mouse (hold the left button down). Click Insert>Chart. Choose XY (scatter) and then the option without lines connecting the data points.
8. Click Next . For Data Range, series in columns should be clicked. Click the Series tab. For series #1, name=Sheet1!$E$1 (this is the sheet and cell that 1990N was typed in). Your x values should give the cell range that the time data is in, for example =Sheet1!$E$3:$E$196. Your y values should give the cell range that the change in magnitude data is in, for example =Sheet1!$F$3:$F$196.
9. Click the next series and do the same as above. For example, name=Sheet1!$G$1 (this is the sheet and cell that 1987A was typed in). Your x values should give the cell range that the time data is in, for example =Sheet1!$G$3:$G$196. Your y values should give the cell range that the change in magnitude data is in, for example =Sheet1!$H$3:$H$196.
10. Remove the third series.
11. Click Next. Enter a title for your chart and labels for your x and y axes.
20. Click Next. Place the chart as a new sheet.
12. Remember that magnitude goes backwards - higher numbers are less bright. Click on the y-axis of your chart. On the screen that comes up, click the Scale tab. Click values in reverse order. Notice that you can also change the range on the axis, where the x-axis crosses, etc.
13. Now you are ready to classify these supernova as Type IA or Type II by comparing their light curves to the ones in the diagram given earlier. You may wish to zoom in on a certain range of days (look at only the first 50 days for example). Remember you can do this by clicking the x-axis and changing the range. You may also wish to change the range of the y-axis to better see and compare the curves. Print your original light curve and any "zooms" you make.
Conclusion:
Review the background material on supernova light curves. How would you classify each of these supernova? Explain your reasoning, referring to your light curves.
Extension Question:
Type Ia supernovas are special cosmic yardsticks that can be used to find the distances to the galaxies in which they occur. Why do you think these types of supernova can be used this way? (Hints: Think of the inverse square law of light and the distance modulus. Also, think about the events leading up to a Type Ia - why does each Type Ia burn with the same brightness?)