 |
| ACTVITIES on Stellar Classification
|
 |
 |
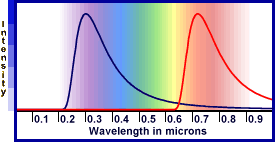
Quick interactive tutorial on the relationship between star temperature, color and the wavelength of peak emission. Write a paragraph explaining these relationships and what you learned in this tutorial. |
Exercise on thermal radiation, line radiation and stars. |
|
Read and answer the questions at the end. Also do the section review. |
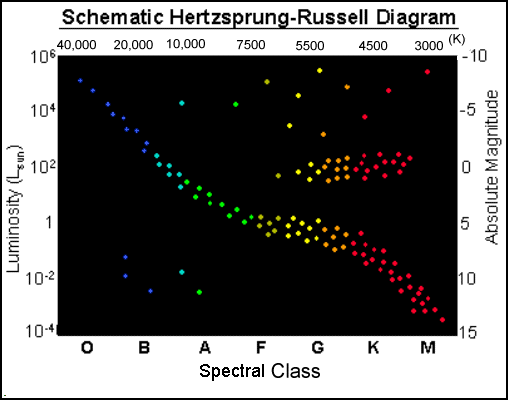
| ACTVITIES on HR Diagrams In the early part of this century, two astronomers, one Danish and one American, invented a diagram showing the basic characteristics of stars. The color-magnitude diagram, often called the Hertzsprung-Russell (HR) diagram in their honor, has proved to be the Rosetta Stone of stellar astronomy. The following exercises will familiarize you with the HR diagram and its uses. |
|
 |
|
Tutorial and online lab. Take notes and do the exercises as you go. Click to open the virtual laboratory frameset at the bottom of the page and then choose "Labs for Semester 2" and then "Lab 2: Spectral Sequence and the HR Diagram" from the menu on the right. Print out the answer sheet. |
||
This lab teaches the basic techniques and criteria of the Morgan-Keenan system of spectral classification. The student examines and classifies the spectra of 10 stars. The behavior of absorption lines and the continuum radiation is also examined. |
||
Background information on the temperature dependence of absorption lines, and spectral types (good follow-up to "Spectral Classification" activity). Answer review questions at the end. |
||
|
||
|
An animated HR diagram to help you understand how a star changes throughout its life. |
||
|
Measure the color and brightness of stars in the Jewelbox Cluster from a color image. Determine the age of the cluster by plotting their measurements in a color-brightness diagram. Here is more information on the Jewelbox Cluster. |
||
|
You will find the ages of two clusters by plotting stellar data on a color-magnitude diagram. Use an excel spreadsheet to make your HR diagram if you know how. To help answer questions #5 and #6, use this HR Diagram. |
   |