2D-3D Plots and Animated Plots

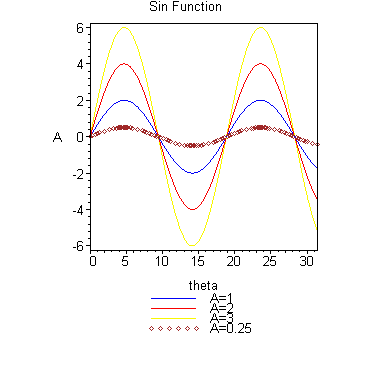
This graph is based on the equation which is written as
y:=2*A*sin(theta/(3*f)).By varying the values of A, this multiplot was yielded.
This is the answer question no.1 (static plot).

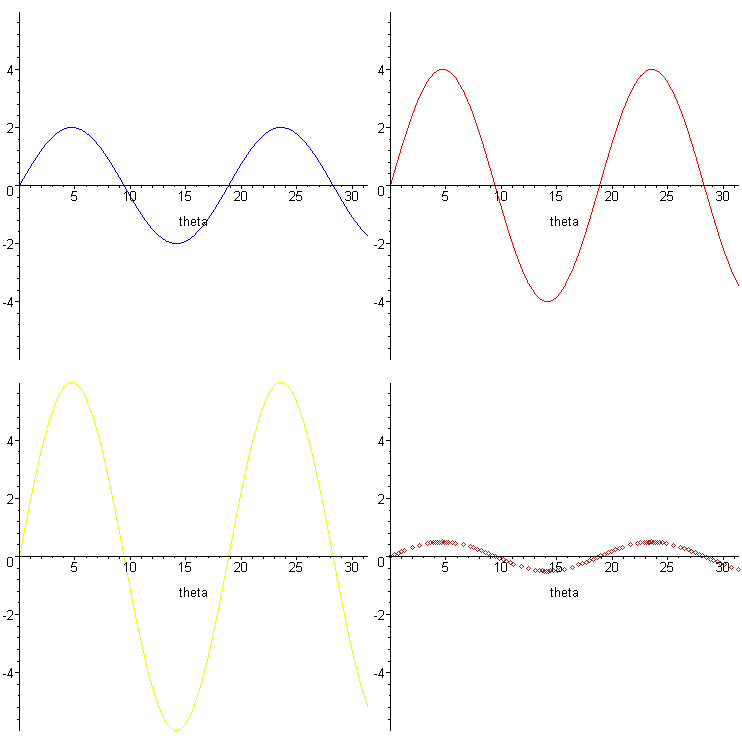
This is the animated form of previous multiplot graph. This curve is based on the same
equation as before, which the range of A values is is between 0.25 and 3 with f=2.

Question no.2:
This structure is representing the equation y:=-6*x^4+12*x^2-3*x+13
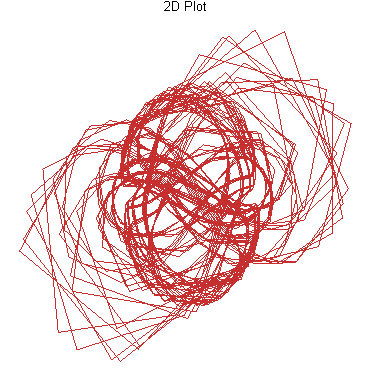
Answer for question no.3(2D plot)

This 2D plot is representing the combination of the function
x:=4*sin(t)+3*cos(t) and y:=2*sin(3*t)-cos(Pi*t)
Answer for question no.3(3D plot)

This plot is representing the function of Y:=4*sin(s)+3*cos(t)
Question no.4 (3D Animation)
Example 1

This 3D Animated plot is representing the function of sin(sqrt(x*y+t^2)
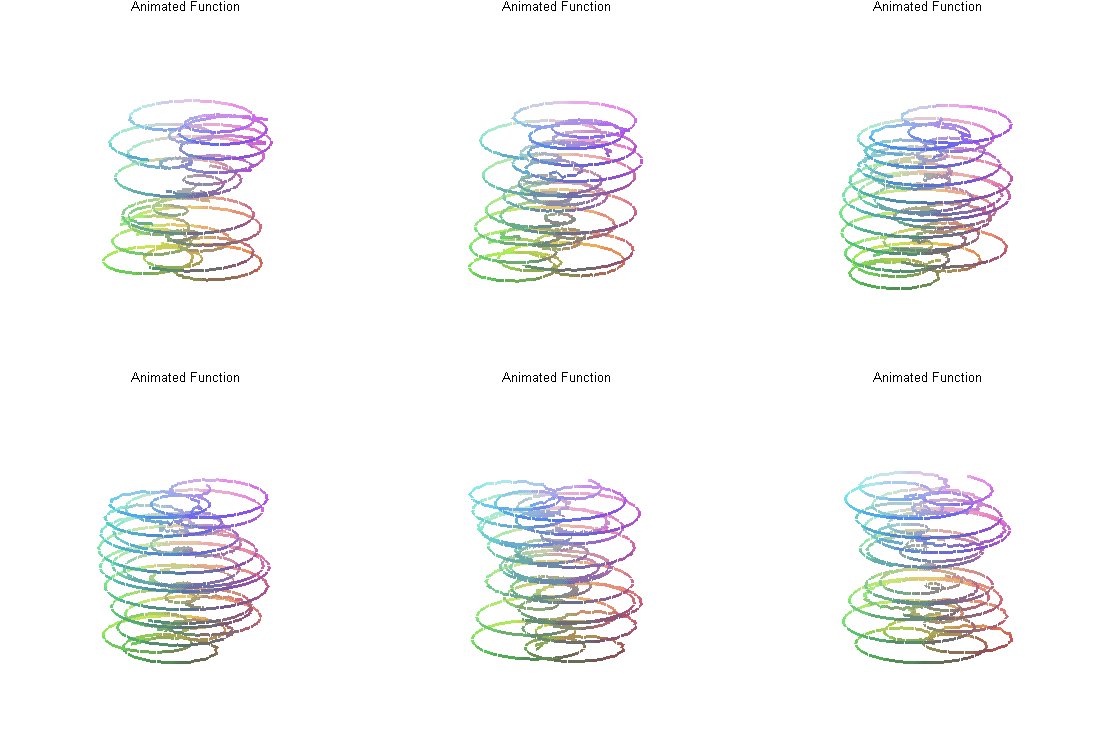
Example 2

This 3D plot is a combination of functions t^1/2,2*cos(t+x) and 3*sin(2*t+x)


