Graph I

Graph I

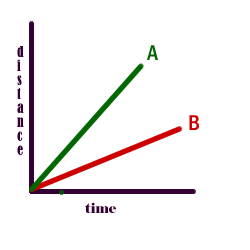
In this graph uniform motion with no acceleration is observed. Line A has a greater slope than line B therefore object A travels faster than object B.
Graph II

In this graph object C is not
moving but it is at a fixed distance from a starting point or origin.
Object D has a uniform velocity
and it started at some distance from the origin.
Graph III

In this graph the object travels with non-uniform motion; it is accelerating at a uniform rate.
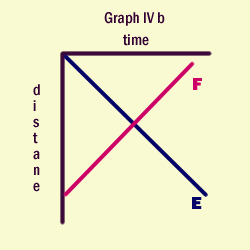
 In this graph the object is at some distance from the start position and returns to the start position. The object in a sence is traveling "backwards".
 In this graph line E represents the object starting from the starting point and traveling backwards from this point. This line represents a vector displecemant, not a distance..
Line F repesents an object starting from a negative position relative to the starting point and traveling in the forward or positve direction to this starting point.
 This graph shows to types of motion. Line A shows an object in motion with a constant velocity over the time interval.
 This graph shows two situations.
Line Chas the object with an initial velocity of V1 and is accelerated at a constant rate over the time interval. The line is similar to line B which starts from rest. The slope yields the acceleration.
Line D has the object starting at some initial velocity and slowing down or deaccelerating. The slope of this line will be negative, therefore the acceleration is negative. Negative means that the vector direction of the acceleration is opposite to the direction of the velocity and motion.
It should be noted that by finding the area under the lines in these graphs the distance or displacement of the object may be determined.
 This graph shows an object starting from rest and its velocity is negative relative to a positive forward diection. It does not mean that this object is slowing down. It's a negative vector. It is similar to line D execpt that the speed is increasing, yet it's velocity is decreasing ( a vector effect). Both the velocity and acceleration are negative.
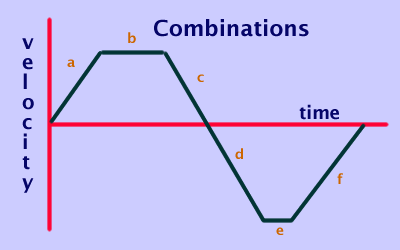
 This is a combination graph where various modes of motion are displayed.
a has the object accelerating in the forward direction from rest.
b has the object traveling at a constant velocity in the forward direction.
c has the object slowing down and coming to rest. The object is slowing down yet still proceeding in the forward direction, away from the starting point.
d the object is starting from rest and proceeding in a backwards direction toward the starting point. THe acceleration is negative only because its direction is oppostite to the forward or positive direction. It has the same magnitude as line c.
e the object stops accelerating and travels at a constant negative velocity away from the starting point.
f the object now starts to slow down, it's velocity is decreasing, and its motion is still backwards toward the starting point. Where line f meets the t axis it has stopped. It does not mean that the object has returned to its starting point.
In order to determine the displacement of the object at the end of line f, the area under each segment must be tabulated. The areas under segments a, b, c are postive. The areas under segments d, e, f are negative. Add up all six segments to determine where the object is from the starting point.
a, b, c : object travels in a postive direction away from the starting point.
d, e, f : object travels in a negative direction back towards the starting point.