
RAPD CHARACTERIZATION OF OPEN POLLINATED PROGENY OF MALLIKA
(2/8) MANGO (Mangifera indica L).
Dissertation submitted to Bangalore University
in partial fulfillment of the requirements for the award of the
Degree of Master of Science in Biotechnology.
By
SAIBYASACHI NATH CHOUDHURY
Under guidance of
Dr. P. Narayanaswamy,
Associated Professor, Division of Horticulture
University of Agricultural Science (GKVK),
Bangalore.
Department of Biotechnology
Administrative Management College
Bangalore University
Bangalore, Karnataka
2002-2003
RAPD CHARACTERIZATION OF OPEN POLLINATED PROGENY OF MALLIKA (2/8) MANGO (Mangifera indica L).
Dissertation submitted to Bangalore University
in partial fulfillment of the requirements for the award of the
Degree of Master of Science in Biotechnology.
By
SAIBYASACHI NATH CHOUDHURY
Regd. No. # 2002 BT 25 .
Under guidance of
Dr. P. Narayanaswamy,
Associated Professor, division of Horticulture
University of Agricultural Science (GKVK),
Bangalore
Department of Biotechnology
Administrative Management College
Bangalore University
Bangalore, Karnataka
2002-2003
CONTENTS
|
Chapter |
Title |
Page
|
|
1. |
|
1 |
|
2. |
|
4 |
|
3. |
|
39 |
|
4. |
|
43 |
|
5. |
|
49 |
|
6. |
|
51 |
|
7. |
|
52 |
|
8.
|
|
61
|
CERTIFICATE
This is to certify that the project titled “RAPD CHARACTERIZATION OF OPEN POLLINATED PROGENY OF MALLIKA (2/8) MANGO (Mangifera indica L.) ” submitted by M. Saibyasachi Nath Choudhury for the award of the degree of Master of Science in Biotechnology , to the Bangalore University , Bangalore, is a record of research work done by him under my guidance and supervision in our Laboratory. During this period of two months, he was punctual, hardworking and had taken very keen interest and initiative in his project. The project work has not previously formed the basis for award of any degree, diploma, associated ship, fellowship or any other similar titles.
Bangalore (Dr. P. Narayanaswamy)

I hereby declare that the work presented in this Dissertation entitled “RAPD CHARACTERIZATION OF OPEN POLLINATED PROGENY OF MALLIKA (2/8) MANGO (Mangifera indica L)” is my own and original. This work was carried out under the guidance of Dr. P. Narayanaswamy, Associated Professor, Chairman of Advisory Committee, HOD of Plant Molecular Biology, Division of Horticulture, University of Agricultural Sciences(GKVK). This work has not been submitted for any other degree in part or in full.
Date.28/03/2003.
Place. Bangalore (Saibyasachi Nath Choudhury)
I wish to place on my record my grateful thanks to Dr. P. Narayanaswamy, Associated Professor, HOD of Plant Molecular Biology, Division of Horticulture, University of Agricultural Sciences(GKVK), Bangalore fro having given me the permission to pursue my project work in the Plant Molecular Biology laboratory of the institute.
I express my deep sense of gratitude to Ganesh C. T. (Ph. D Scholar) for his excellent guidance and generous help in pursuit this project work.
I take the opportunity to express my thanks and gratitude to all the faculty member of Department of Biotechnology, A. M. College, for their immense help, guidance and encouragement not only for the project but also during the entire M. Sc. course.
My deepest gratitude to my parents, and brother for their constant encouragement and good wishes throughout my life.
Bangalore (Saibyasachi Nath Choudhury)

Introduction
CHAPTER ONE
INTRODUCTION
Mangifera L (X=10) has about 62 spp. In South East Asia, of which only 50 spp. yield edible fruits. But only one sp. M. indica is widely planted throughout the tropics. Mango (Mangifera indica L.; 2n= 40) belonging to family Anacardiaceae is called as the king of fruits for it’s excellent taste and flavor and is one of the most popular and choicest fruit of India, so called the national fruit of India.
Mango probably originated in the Indo-Burma region and grows wild in the forests of India, especially in the hilly areas in the northeast. It has been cultivated in India for more then 4000 years. At present Mangoes are grown in all the warmer regions of the world, i.e. in all countries of south-east Asia, tropical Australia, the coastal regions of Africa including the sores of Mediterranean, the Pursian gulf, the Pacific islands, Hawaii and the lowlands of Central and South America., including South Florida and California.
With the production of 51.18 per cent of the total world mango production, i.e. 19.22 million tons, India stands first in Mango production. The area under Mango cultivation in India is 1.23 million ha with an annual production of 10.99 million tons (Negi, 2000). The total area under cultivation in Karnataka during 1999-2000 was 1, 33,806 ha with an estimated production of 12, 86, 224 tons (Anonymous., 2001).
Mango has both economic use as well as medicinal use. Ripe fruits are mostly eaten fresh or made into jams, jellies, and squash or canned. Unripe fruits are used in pickles, chutneys other culinary preparations or sometimes dried and powdered to prepare amchur. Mangoes can be fermented to vinegar or wine and brandy. In times of scarcity the seeds are used for human food which contains eight- percent protein. Urine of cattle fed on mango leaves are sometimes used as yellow dye. In Hindu mythology mango leaves, branches and twigs play an important role. The various parts of mango are used as antihelmintic, diaphoretic, and refrigerant and in bleeding piles, menorrhagia, scabies & cutaneous infections, leucorrhoea, diarrhoea & dysentery.
Of more then 1000 varieties of mangos known in the entire world, only 25 to 40 are of commercial importance. About 600 varieties are available in India, which are distinguished based upon leaf, panicle, fruit, and stone characteristics. Since mango has been under cultivation in India since antiquity and a highly cross-pollinated, there are thousands of varieties if mango arising from natural cross-pollination or mutation. Indian cultivars are mainly polyembryonic; in the Philippines and Hawaii they are mainly polyembryonic. Seedling trees from zygotic embryos do not breed true and their fruits are often fibrous and turpentine-flavored, while seedlings from apomictic embryos will be the same genetically as the parent. Named clones are usually propagated vegetatively. Cultivars are often chosen for color and flavor rather than yield. Each local area has tended to select cultivars suited to their local environment. In India ‘Alphonso’ and ‘Malgoa’ are well known cultivars. Mallika is another well known hybrid variety produced by crossing ‘Neelum’ and ‘Dashehari’ in 1965 at the Division of Fruit and Horticultural Technology, IARI, New Delhi. Mallika fruit contains about one and half to two times more b-carotenoid pigments than its parents do. Pulp content is high (75 per cent) (Pandey, 1998).
Earlier for crop improvement the selection of crop was done by Morphological markers, i.e. based on phenotypic/morphological character of the crop plants. This method had a disadvantage that it varied with environmental conditions and takes years for the crop to grow and fruit on the basis of which the quality of plant can be identified. So another method was developed using Biochemical markers i.e. Enzymes, Secondary metabolites, etc. which was much more reliable, consistent and unaffected by environmental conditions. But this method also has a disadvantage that it varied with the stages of development and tissue used for extraction. This problem was overcome with the development of DNA based markers which is again divided into two types -: PCR based markers and Restriction based markers. PCR based markers include RAPD, AFLP, Microsattellites and Restriction based markers includes RFLP.
Though in most of the studies of Genetics RFLP markers were used because it came before the development of PCR which lead to RAPD method. In our lab we used RAPD marker for study of genetic diversity and characterization of genetic profile because of its advantage over RFLP method. In RAPD method there is no requirement for DNA sequence information. The protocol is relatively quick and easy to perform and uses fluorescence instead of harmful radioactivity (William et. al., 1992). Moreover less amount, i.e. only nanogram of DNA is essential for RAPD technique since it is based on amplification of DNA.
The recent developed DNA based markers like RAPD & RFLP methods provide excellent duplicates in germplasm, study genetic relationships, gene tagging, genome mapping, etc. these markers measure diversity at DNA level and are seldom influenced by environmental conditions.
Now a day various varieties of mango saplings are available on market, some of which looks similar. So it is very difficult to identify a variety on the basis of morphological feature. Since the mango plant will take four years to grow and fruit and only then the quality and purity of the variety can be identified. So with the development or application of RAPD technique the purity and quality of the sapling can be identified by obtaining genetic profile and comparing it with the recorded gene profile of the mango varieties and that also in a period of two weeks.
Considering the above information, an investigation was undertaken in Plant Molecular Biology Laboratory, Gandhi Krishi Vigyan Kendra, University of Agricultural Sciences, Bangalore, to obtain a RAPD profile of open pollinated progeny of “Mallika (2/8)” mango using four Operon primers- OPA 01, OPB 01, OPC 12, OPD 07.
The important objectives are:
1. To standardize the protocol for extraction of good quality DNA in mango,
2. To develop protocol for PCR amplification and electrophoresis,
3. To analyze open pollinated progeny of Mallika (2/8) mango genetically.
Review
Of
Literature
Mangifera L. (X=10) has about 62 spp. In south-east Asia and Malaysia to New Guinea, with the greatest number of spp. in the Malaya peninsula. Of these, 15 spp. are widely planted throughout the tropics. Some spp. which are cultivated in orchards in the East but give inferior fruits to M. indica are M. caesia Jack, M. foetida Lour, M. lagenifera Griff, M. odorata Griff, M. zeylanica Hook.
Mango (Mangifera indica L., 2n=40) belonging to family Anacardiaceae is called as the king of fruits for its taste and flavor and is one of the most popular and choicest fruit of India. It is believed to be the native of Indian subcontinent and has been under cultivation from the past four thousand years. Mango undoubtedly deserves to be the national fruit of India, and occupies the same position in as the Apple in temperate climates. Among the fruits produced in India, mango occupies 43 per cent of the total area under fruits in India. Major states growing mango are Uttar Pradesh (33.2 per cent), Bihar (13.5 per cent), Andhra Pradesh (13.4 per cent) and Karnataka (7.8 per cent).
Mango probably originated in the Indo-Burma region and grows wild in the forests of India, especially in hilly areas in the north-east. It has been cultivated in India for more than 4000 years. Its cultivation in ancient India is evident from representation of mango trees on the Buddhist stupas of 110 B.C., including the famous Barhur stupa. Descriptions of the mango are found in ancient Sanskrit or Urdu poems and verses of ancient mugal times. Akbar, the mugal emperor (1556-1605) planted an orchard of 100,000 mango trees called Lakh Bagh near Darbanga (Bihar).
It was probably taken to Malaya and neighboring East Asian countries by Indians in the 5th or 4th century BC and was also introduced into East Africa by the Persians by the tenth century AD the Portuguese colonists took it from India to Brazil around 1700. They also planted it in tropical Africa. Mango seeds from Rio de Janeiro, Brazil were carried to Mexico in early 1800s. The British planted mangoes in the islands of Jamaica in 1782, which later received its first grafted mangoes from India via Kew in 1869. In 1833 it was introduced into Florida but was unsuccessful, but was later successfully introduced in 1861. At present, mangoes are grown in all the warmer regions of the world, i.e. in all countries of south-east Asia, tropical Australia, the coastal regions of Africa including the sores of Mediterranean, the Persian gulf, the Pacific islands, Hawaii and the lowlands of Central and South America, including southern Florida and California.
DESCRIPTION OF PLANT
2.1(a). MORPHOLOGY
Plant: an erect, branched, evergreen tree, 10-40m high, life span of 100 years or more, with dense dome-shaped canopy.
Root: long taproot up to 6m in depth.
Stem: Grayish-brown pronounced trunk, fissured bark, branchlets stout.
Leaves: Spirally arranged, glabrous, exstipulate, produced in flushes; young leaves usually reddish in color later turning dark shiny green and remaining on tree for a year or more. Petiole 1-10cm long, somewhat flattened on upper surface and with pulvinus at the base. Lamina 8-40´2-10cm, narrowly elliptic or lanceolate, leathery, apex acuminate, base tapering, margin undulate; midrib prominent and up to 30 pairs of lateral veins; stomata on both surfaces, but more on lower surface.
Inflorescence: Widely branched terminal panicle, 10-60cm in length, with 1000-6000 flowers borne. Branches often tinge red and usually pubescent. Polygamous with male and hermaphrodite flowers.
Flowers: 5-8mm in diameter in cymes or branchlet; subsessile, sweet scented. Floral formula is
Sepals, yellowish green, hirsute. Petals, cream with 3-5 darker yellow ridges on inner surface, petals later becoming pinkish. Pistil abortive in male flowers, single anatropous ovule.
Fruit: Fleshy drupe; 2.5-30cm long; rounded to ovoid-oblong and sometimes laterally compressed; color with varying mixtures of green, yellow and red. Pistillate area near proximal end may develop into beak. Basal end may be depressed, elevated or intermediate. Exocarp of varying thickness, texture and flavor from soft free and fibers, sweet and juicy to fibrous and turpentine-flavored; endocarp thick, woody and fibrous.
Seed: stony endocarp, variable in size; testa and tegument represent as two papery layers; exalbuminous; two fleshy cotyledons. Some seeds monoembryonic with zygotic embryo only (occasionally apomictic); others polyembryonic with 2-12 embryos in which apomictic embryos are produced from the epidermal cells of the nucellus and in which zygotic Indian cultivars are mainly monoembryonic; in the Philippines and Hawaii, the seeds are mainly polyembryonic.
2.1(b). ECOLOGY
Mango is a tropical fruit and is adapted to tropics and sub-tropical climates. It can be cultivated from sea level up to an altitude of 1500 meters above mean sea level is ideal for commercial cultivation of mango. The optimum growth temperature is 24°C-26°C. However, mango can withstand a temperature as high as 48°C under irrigated condition. It can be grown in areas with a rainfall from 25cm-250cm but annual rainfall of 75-190cm is generally desirable. High rainfall and humidity during flowering and fruit ripening periods are harmful. Dry conditions before blossoming are good for profuse flowering. For good crop, dry weather and a cloudless sky during flowering and fruit ripening are essential. Strong winds and cyclones during the fruiting season will blow away the crops. The limiting factor for production of mango could be frost or low temperatures especially during flowering. The mango trees prefer well-drained soils with a pH between 5.5 and 7.5. Very fertile soils with adequate supplies of water through out the year may result in luxuriant vegetative growth and poor cropping. Mango may only produce one good crop every 3-4 years. This is influenced by climate and cultivars; a high C/N ratio is required for flowering initiation.
Some of the best mango groves in India are on the Indo-Gangetic plain with deep alluvial soils and in areas of lateritic soil. Mango is cultivated in arid and semi-arid zones of Karnataka.
2.1(c). CULTIVARS
Of more than 1000 varieties of mango known in the entire world, only 25-40 are of commercial importance (Chadha and Pal, 1986). About 600 varieties are available in India, which are distinguished based upon leaf, panicle, fruit, and stone characteristics. Since mango has been under cultivation in India since antiquity and is highly cross-pollinated, there are thousands of varieties of mango arising from natural cross-pollination or mutation. Indian cultivars are mainly monoembryonic; in the Philippines and Hawaii they are mainly polyembryonic. Seedling trees from zygotic embryos do not breed true and their fruits are often fibrous and turpentine-flavoured, while seedlings from apomictic embryos will be the same genetically as the parent. Named clones are usually propagated vegetatively. Cultivars are often chosen for color and flavor rather then yield. Each local area has tended to select cultivars suited to its local environment. In India ‘Alphonso’ and ‘Mulgoa’ are well-known cultivars. Some of the commercial cultivars or popular varieties grown in India are: -
Allumpur Baneshan, Alphonso, Amrapali, Arka Anmol, Arka Aruna, Arka Puneet, Au-Rumani, Bangalora, Banganpalli, Bombay Green, Cherukrasam, Dshehari, Dilpasand, Fazli, Goa Munkur, Hamlet, Himayuddin, Janardhan Pasand, Jehangir, Kalapadu, Kesar, Khas-ul-khas, Khuddus, Kishen-Bhog, Langra, Mallika, Mulgoa, Nellum, Neelgoa, Neeluddin, Nekkare, Pairi, PKM-1, PKM-2, Pulihora, Rajapuri, Rajgira, Ratna, Ranagiri Alphonso, Rumani, Sindhu, Suvarna Jehangir, Suvarnarekha, Tenneru, Vanraj, Willard, Zardalu.
2.1(d). CHEMICAL COMPOSITION
Edible portion of ripe fruit is 60-75 per cent by weight. Mango is rich source of vitamin A & C. The average values of other nutrients are given below:-
Protein 0.6 per cent
Fat 0.1 per cent
Mineral matter 0.3 per cent
Fibre 0.9 per cent
Carbohydrates 11.8 per cent
Calcium 0.01 per cent
Phosphorus 0.02 per cent
Iron 0.3 per cent
Calorific value 50 cal/100g pulp
Carotene, Vit. A 4800 IU/100g pulp
Vitamin B1 40 mg/100 g pulp
Nicotinic acid 0.3 mg/100 g pulp
Vitamin C 32 – 62.9 mg/100 pulp
2.1(e). Uses (Economic uses)
1. Ripe fruits are mostly eaten fresh as a dessert fruit, but are also made into jams, jellies, squash, and are sometimes canned.
2. Unripe fruits are used in pickles, chutneys and other culinary preparations.
3. Thin slices of unripe mangoes are dried in the sun and powdered to form amchur which is used as souring agent for soups, chutneys and vegetables.
4. The juice of mango fruit is dried in the sun to form mango leather (known as am-papad).
5. In times of scarcity the seeds are used for human food. It contains about 8 per cent protein.
6. Mangoes can be fermented to vinegar or wine and brandy.
7. Urine of cattle fed on mango leaves is used as a yellow dye.
8. The timber is used for making boats.
9. In Hindu mythology mango tree plays an important role. Mango leaves are used at almost all Hindu ceremonials and festivals. The mango wood is also used by Hindus for burning corpses.
1. The kernel is used as antihelmintic.
2. It has been successfully used in bleeding piles and manorrhagia, due to its Gallic acid content.
3. It acts as a diaphoretic and refrigerant, due to the presence of acid and turpentine.
4. A soft reddish brown gum – resin on mixing with lime juice or oil is used externally in scabies and cutaneous infections.
5. The bark of the tree is administered in infusion in menorrhagia and leucorrhoea.
6. The resinous juice mixed with egg white and a little opium is used for diarrhoea and dysentery.
The total world production exceeds 11,500,000 tons (ANONYMOUS,1987), of which nearly 8,500,000 tons come from India. Other producers after India, in order of importance are Pakistan, Brazil, Mexico, Bangladesh, the Philippines, Tanzania, Dominican Republic, Colombia, Haiti, Venezuela, Egypt, Zaire and Peru.
Though India is the largest mango producing country accounting for 66.2 per cent of the world production, the export of mango and mango products from India is limited (12000tons of mango and mango products as against a total of 88, 60,000 tons of mangos). India exports approximately 1,000 tons of mango pickles annually, of which the largest quantity goes to the United Kingdom. Only 28 per cent of the fresh mangoes available in the international market are from India, whereas Philippines which is 5th in production of mango in the world meets 35 per cent of international demand.
According to the annual report published by director of Horticulture(Horticulture crop Stastics of Karnataka State at a Glance), Lalbaugh, Bangalore for the year 1999-2000 , the area under mango cultivation in Karnataka is 1,33,806 ha and the production is 12,86,224 tons. The districts of Karnataka where commercial cultivation of mango is done are Chickmangalore, Bagalkot, Dharwad, Bijapur, Belgaum, Gadag, Raichur, Koppal, Bellary, Bidar with the maximum production in Belgaum i.e. 25561 tons in 5202 ha.
Mango-hopper or jassid, Idioecerus spp. is the most important pest of mango and is active during flowering season. Both adult and nymph suck sap from tender shoot and panicle resulting in wither of panicles. The pest can be controlled by spraying Malathion (0.15 per cent) or Diazinon (0.15 per cent).
Mealybug: The females lay eggs in the emergence of the nymph coincides with the flowering season (Dec-Jan) and they suck juice from young shoots. The damage could be minimized by digging the soil before emergence of nymphs to destroy the eggs. The nymphs can be controlled by timely and periodic spraying of Nuvacron (0.04 per cent).
Fruit fly : It includes the Mediterranean fruit-fly [Ceratitis capitata (Wied.)], Mexican fruit-fly [Anastrepha ludens (Loew.)], South American fruit-fly [A.fraterculus(Wied.)], West Indian fruit-fly (A. monbinpraeoptans Sein.) and Dacus spp.; attack mangoes in various parts of the world by laying eggs in mature fruits on which the larvae feed rendering them useless for human consumtion. Some control is possible by the destruction of fallen infected fruits.
The other important pests of mango are shoot-borer, bark-eating caterpillar, leaf-cutting weevil and stone weevil. Shoot-borer can be controlled by spraying Nuvacron (0.04 per cent). The bark-eating caterpillar can be controlled by removing the affected portion and mechanically killing the insect by petrol or ethylene glycol injection. Leaf-cutting weevil is controlled by spraying Malathion (0.1 per cent). The stone-weevil is prevalent in South India and this can be controlled by clean cultivation and proper sanitary measures.
Powdery mildew:This is the most serious & widespread disease of mango caused by Oidium mangiferae Berthet and can destroy the crop. Cloudy weather and high humidity are predisposing factors for this disease that appears as grayish-white powder on the surface of leaf and can also affect the panicle. Affected panicles dry and turn black resulting in entire loss of crop in extreme cases. This disease can be controlled by timely spraying of wettable Sulphur (0.2 per cent)/Kerathane (0.1 per cent), Bavistin (0.1 per cent) or Benlate (0.1 per cent).
Anthracnose: It is fungal disease caused by Colletotrichum gloesporioides Penz. and is the most serious & widespread disease of mangoes, particularly in moist climates. The shoots, leaves, flowers and inflorescence are affected by this disease with a characteristic symptom of necrosis of the affected areas. The young shoots dry up causing die-back and the affected inflorescence shed fruits. This disease is also effectively controlled by timely spraying of Benlate (0.1 per cent) or Bavistin (0.1 per cent).
Mango malformation: It is very severe malady or disorder of mango in Northern India caused by several factors. There are two kinds; vegetative and floral. Vegetative malformation is more common in nursery plants while the later affects the inflorescence and causes total loss. The productivity of the trees can be improved by spraying NAA (200 ppm.) in the first week of October and deblossoming once at the bud-burst stage.
2.1(i). IMPROVEMENT
For crop improvement of mango, the clones from existing seedling populations are selected on the basis of their propagated vegetatively.
Some varieties are produced by hybridization in India & Florida without much success.
2.2. Polymerase chain reaction
The PCR is an alternative to cloning for isolation of DNA sequence. PCR can selectively amplify a single copy of the desired sequence that is present in a complex mixture of other DNA molecule. Billions of copies of the target sequence i.e. the sequence which is to be amplified can be made by PCR without having to purify it beforehand.
In the first cycle of the PCR, the DNA in a molecule is melted by raising the temperature to 95 degrees. After the strands have separated the temperature is lowered to 60 degrees so that a pair of short oligonucleotide primers specific for the 3’ ends of the target sequence can bind one primer on each strand. The primers then direct the DNA polymerase called taq to synthesize the complimentary DNA strands from free nucleotides. In the entire mixture of the genomic DNA molecules, one DNA containing the target sequences copied because the taq polymerase can only copy molecules that have a primers attached. At the end of cycle one, both strands of the genomic DNA molecule have been copied to form two partially double stranded DNA molecules.
In the next cycle, the same steps are repeated. DNA duplexes are again melted by heating to 95 degrees. Since taq polymerase has the special property of being thermo stable, it is not inactivated at this high temperature. The primers annealed to the target when the temperature is lowered and the target strands are extended by the taq polymerase. The temperature can be raised to 72 degrees to speed this reaction. At the end of the cycle two, four partially double stranded molecules are produced all contain the target sequence plus some adjacent DNA.
The number of target sequences continues to grow exponentially at each cycle. By the end of cycle thirty, the target sequence grows to mare then a billion double stranded target molecules whereas there are only 60 copies of the longer DNA molecules. This means that the final product is virtually pure target sequence, thus like cloning PCR selectively generates a large number of copies of DNA sequence for the original mixture of DNA sequences.
2.3. USE OF DNA PROFILING
DNA profiling is used in the following:
2.4. MARKERS
2.4(a). PROPERTIES OF IDEAL MARKERS
An ideal marker should:
2.4(b). MORPHOLOGICAL MARKERS
The oldest and most widely used genetic markers are the morphological traits, which are still useful for certain germplasm and cultivars management applications where the cultivars have been identified based on morphological characteristics. These characters however may change with environmental conditions. Moreover, the actual identity of some cultivars is still in question because similar cultivars grown in different areas often have various names (Lakshminarayana, 1980). The main advantages of morphological markers are its simple process, inexpensive assays and the disadvantages are that it vary with environmental condition, it’s a personally biased judgment. Because of the above disadvantages Biochemical markers were developed.
2.4( c). BIOCHEMICAL MARKERS
In these enzymes, secondary metabolites, etc. are used as biochemical markers. The advantage of this over the morphological markers is that it is more reliable, consistent and unaffected by environmental conditions. The disadvantage of biochemical marker is that the biochemical constituent used as marker is influenced by stages of development and tissue used for extraction.
2.4(d). MOLECULAR MARKERS
The discovery of molecular marker lead to the detailed genetic analysis and approaches to improvement of crop plants. It is differentiated into Protein markers which were discovered first and DNA based markers. Protein markers had a disadvantage that the proteins are effected by the influence of environment so DNA markers are developed. The DNA markers are again categorized into Restriction based markers [Restriction Fragment Length Polymorphism (RFLP)] and PCR based markers [Random Amplified Polymorphic DNA (RAPD), Amplification Fragment Length Polymorphism (AFLP), Microsatellites, Inter-Simple Sequence Repeats (ISSR)]. The DNA based markers like RFLP and RAPD provide excellent tools to study the genetic diversity, eliminate duplicates in germplasm, study relationships, gene tagging, genome mapping , PVR(Plant Varietal Rights) purposes, etc. the advantages of DNA markers are direct evaluation of genetic material, numerous markers can be obtained in a single population, assessment is not affected by environmental condition, it is powerful to pick up even minute differences , and it requires little amount of plant tissue for analysis.
Restriction based markers or RFLP is obtained when genomic DNAs from each of several individuals belonging to one or more species are digested separately with restriction enzymes, electrophoresed, blotted on a membrane, and probed with a labeled DNA clone, polymorphism in the hybridization pattern is sometimes revealed and attributed to sequence differences between the individuals. Such variation is termed as “restriction fragment length polymorphism” (RFLP). Variation in one DNA fragment obtained with a specific enzyme is treated as one RFLP.
RANDOM AMPLIFIED POLYMORPHIC DNA (RAPD) MARKERS
This method of DNA polymorphism analysis was developed independently by two different laboratories (Welsh and Mc Clelland, 1990; Williams et al., 1990). This procedure detects nucleotide sequence polymorphisms in a DNA amplification based assay using only a single primer of arbitrary nucleotide sequence using Polymerase Chain Reaction (PCR). In this reaction, a single species of primer binds to the genomic DNA at two different sites on opposite strands of the DNA template. If these primary sites are within an amplifiable distance thermocyclic amplification. The presence of each amplification product identifies complete or partial nucleotide sequence homology, between the genomic DNA and the oligonucleotide primer at each end of the amplified product. On an average, each primer will direct the amplification of several discrete loci in the genome, making the assay an efficient way to screen for nucleotide sequence polymorphism between individuals.
The major advantage of this assay over RFLP method is that there is no prior requirement for DNA sequence information of the genome. The protocol is also relatively quick and easy to perform and uses fluorescence in lieu of radioactivity (Williams et al., 1992). Because the RAPD technique is amplification – based assay, only nanogram quantity of DNA are required and automation is feasible.
The stepwise procedure for RAPD analysis is:-
This technique can be used to determine taxonomic identity, assess kinship relationships, detect interspecific gene flow, analyze hybrid speciation, and create specific probes. Advantages of RAPDs include suitability for work on anonymous genomes, applicability to work where limited DNA is available, efficiency and low expense (Hadrys et al., 1992). It is also useful in distinguishing individuals, cultivars or accessions (Karp et al., 1996). RAPDs also have applications in the identification of asexually reproduced plant varieties for forensic or agricultural purposes, as well as ecological ones (Congiu et al., 2000).
By using different primers, molecular characters can be generated that are diagnostic at different taxonomic levels. RAPD amplification products can be either variable (polymorphic) or constant (non-polymorphic). In a RAPD analysis of several individuals within a species, and species within a genus, constant fragments diagnostic for a genus may be identified, as well as fragments which are polymorphic between species of the genus (Hadrys et al., 1992).
RAPDs can be applied to analyze fusion of genotypes at different taxonomic levels. At the level of the individual, RAPD markers can be applied to parentage analysis, while at the population level, RAPD can detect hybrid populations, species or subspecies. The detection of genotype hybrids relies on the identification of diagnostic RAPD markers for the parental genotypes under investigation (Hadrys et al., 1992). However RAPD markers tend to underestimate genetic distances between distantly related individuals, for example in inter-specific comparisons. It is wise to be cautious when using RAPD for taxonomic studies above the species level (Caetano-Anolles, 1998).
Arnold et al. (1991) have demonstrated interspecific gene flow between two Louisiana iris species, Iris fulva and I. hexagona, by analyses of species-diagnostic RAPD markers. Using two 10-bp and one 16-bp primers they reported four species-specific markers from different populations of I. fulva. These markers were missing in I. hexagona, but were present at intermediate frequencies in experimental F1 hybrids (I. fulva X I. hexagona) and at variable frequencies in a natural contemporary hybrid population. Variable frequencies of species-diagnostic markers were also found in the putative hybrid species I. nelsonii. Here, RAPD markers can be useful in investigating the role of hybridization in the origin of this species (Hadrys et al., 1992).
RAPDs have also begun to be used for analyses of hybridization events where allozymes have not proven to be sensitive enough for hybrid genotypes. RAPDs may also be used to assess paternity and kinship relationships in large offspring samples, to determine the actual father from a number of potential fathers (Hadrys et al., 1992). Conventional RFLP techniques are ill-suited for the analysis of paternity and estimation of reproductive success in species with large offspring clutches, because of the need to determine paternity for each individual offspring. RAPD fingerprinting provides a ready alternative for such cases. Synthetic offspring may be produced by mixing equal amounts of the DNA of the mother and the potential father. The amplification products from the synthetic offspring should ideally contain the full complement of bands that appear in any single offspring of these parents (Hadrys et al., 1992).
Any diagnostic RAPD marker can be eluted from the gel, reamplified, radiolabelled with P32 and then serve as an inexhaustible supply of probe in Southern hybridization. Such probes may be used to exclude the possibility of co-migration of fragments of different sequence but similar size. Other applications include generation of probes for taxonomic analysis or the quantitative estimation of the presence of a certain genome in a mixed sample by Southern analysis. RAPD probes have been used to detect RFLPs in tomato species (Hadrys et al., 1992).
RAPDs have been used to devise conservation strategies for an endangered plant, Grevillea scapigera (Proteaceae), by studying the genetic variability and geographical spread of the remaining 27 individuals of this species. The knowledge of the genetic diversity of the species would enable the selection of appropriate genotypes to maximize the genetic diversity as a basis for a sound recovery plan for the species (Rossetto et al., 1995).
The use of RAPDs in an investigation of the bush mango (Irvingia gabonensis and I. wombolu) from central/west Africa led to several interesting discoveries about the two species. This included the fact that there was significant genetic integrity in the two morphologically similar species, with no evidence of hybridization, even amongst individuals from areas of sympatry where hybridization was considered probable. The results also indicated that, although the two species were so morphologically similar that several samples collected in the field and residing in herbariums were misidentified, they had distinct and separate RAPD profiles, despite previously being classified as one species. Genetic profiles of the samples collected for the study showed that some samples were found to have been misidentified in the field and were in fact samples of individuals of the other species. This study again shows that RAPD analysis can be used effectively for the initial assessment of levels and partitioning of genetic variation within plant species, particularly in species for which there is little other genetic diversity information available (Lowe et al., 2000).
2.5. Genetic diversity
Mangoes are classified into two groups, monoembryonic, based on their ability to reproduce from seeds. Most monoembryonic cultivars are propagated vegetatively by grafting or budding onto monoembryonic or polyembryonic seedling rootstocks. Polyembryonic cultivars are propagated either from seed or by grafting onto polyembryonic seedling rootstocks. There appeared to be considerable variability within certain cultivars, which can be attributed either to somatic mutation (Young and Ledin, 1954) or to the influence of non-uniform monoembryonic rootstocks. The ‘Davis-Haden’ originated as a sport from ‘Haden’. “Alphonso” and “Puthi” are thought to be chimeras (Singh, 1960). Gan et al. (1981) observed considerable variation within vegetatively propagated mango cultivars based on polymorphism of four enzymes from leaf tissues.
The nomenclature of Mangifera species and mango cultivars has been complicated by the widespread use of synonyms (Lakshminarayana, 1980). ‘Philippine’ is believed to be the same clone as ‘Manila’, and ‘Cecil’ and ‘Caraboa’ have been thought to be the same cultivar. Although the centre of diversity of Mangifera is in South East Asia, the largest number of mango cultivars is found in India. There are at least 1000 named cultivars in India; however, it is likely that many of them describe the same clone in different locales. Since little is known about the genetic diversity in wild M. indica populations, Mukherjee (1985) recently made a detailed gene pool survey based on herbarium collections. He identified several diverse genotypes possessing useful horticultural characteristics that could be utilized for mango breeding; however, the known genetic diversity has hardly been exploited.
2.5. Discriminating cultivars
Identification of cultivars and validation of genetic relationships in Mangifera indica L. was carried out using RAPD markers (Schnell et al., 1995). Twenty-five accessions of mango were examined for RAPD genetic markers with 80 decamer random primers. Of the 80 primers screened, 33 did not amplify, 19 were monomorphic and 28 gave reproducible, polymorphic DNA amplification patterns. Eleven primers were selected from the 28 for the study. The number of bands generated was primer- and genotype-dependent, and ranged from one to ten. No primer gave unique banding patterns for each of the 25 accessions; however, ten different combinations of two primer banding patterns produced unique fingerprints for each accession. A maternal half-sib (MHS) family was included among the 25 accessions to see if genetic relationships could be detected. RAPD data were used to generate simple matching coefficients, which were analysed phenetically and by means of principal co-ordinate analysis (PCA). The MHS clustered together in both the phenetic and the PCA while the randomly selected accessions were scattered with no apparent pattern.
Identification of Citrus spp. in Cheju using Isozyme, RFLP and RAPD markers was carried out by Lee et al. (1993). Isoelectric focusing electrophoresis for esterase, peroxidase and malate dehydrogenase isoenzymes in leaf extracts from 16 accessions (including 10 cultivars of C. unshiu) from Cheju island revealed genotypic differences, allowing similarities between accessions to be estimated. Native species such as C. grandis, C. junos, C. platymamna and C. sunki were markedly different (similarity index below 0.7) from introduced species such as C. sinensis and C. unshui. A genomic DNA library of C. unshui was constructed for RFLP analysis, RAPD analysis showed distinct polymorphism between 8 accessions.
Identification of 11 apple cultivars was done using RAPD markers by Koller et al. (1993). A set of bands consistent in their presence or absence was chosen to create a differentiating band pattern. A key is proposed by which one can differentiate apple cultivars using commercially available primers.
Tancred et al. (1994) used PCR-RAPD technique to improve the plant variety rights description of a new Queensland apple (Malus domestica) cultivar. A new, early maturing cultivar ‘GB63-43’ was differentiated from three other cultivars of similar appearance, ‘Summerdel’, ‘Jonathan’ and ‘Royal Gala’ using RAPD-PCR techniques. The presence of a 700 bp band in the three cultivars was shown using the primer M4 (5’ GGCGGTTGTC 3’). This technique allowed the sampling of trees even when dormant or too young to bear fruit.
Cheng et al. (1996) identified co-dominant RAPD markers tightly linked to fruit skin color in apple. A simple genetic basis for the red/yellow skin-color polymorphism in apple was verified using DNA markers. Bulked segregant analysis identified one 10-base oligomer that generated different fragments in each of the bulks. After testing the primer in four populations, two fragments were associated with red skin colour and another two were associated with yellow skin colour. Three of the fragments (1160, 1180, and 1230 bp) were partly sequenced and found to share high sequence homology, suggesting that these were generated from the same locus. A pair of universal primers was designed to amplify the fragments. In the cross ‘Rome Beauty’ ´ ‘White Angel’ population, two fragments were associated with red skin colour: one fragment designated as A1 (1160 bp) was from ‘Rome Beauty’ and another fragments A2 (1180 bp) was from ‘White Angel’. Progeny possessing either fragments, or either one, had red fruits. Both parents displayed an alternate fragment, a1 (1230 bp), associated with yellow-skinned fruit. In three other crosses tested, only fragment A1 co-segregated with red skin colour and two fragments, a1 and a2 (1230 and 1320 bp, respectively), were associated with yellow skin colour.
These results are consistent with the hypothesis that the red/yellow dimorphism is controlled by a monogenic system with the presence of the red anthocyanin pigmentation being dominant. There was no indication that other modifier genes could reverse the effect of the locus (Rf) linked to the markers. Examination of amplification products in 56 apple cultivars and advanced breeding selections demonstrated that the universal primers could be used to correctly predict fruit skin colour in most cases.
Preliminary RAPD tests were carried out by Lewis (1992) on avocado cultivars ‘Hass’, ‘Fruerte’ and ‘Edranol’ indicated that three arbitrary synthetic DNA primer sequences homologous to regions of the avocado chromosomal DNA. The products of the PCRs were separated by electrophoresis and the presence or absence of bands statistically analysed to determine similarities between the cultivars. ‘Fuerte’ and ‘Edranol’ were found to be closely related.
The study was undertaken by Noth et al. (1996) to address the question of whether mummified fig fragments – found during archaeological investigations of the Abydos necropolis in Egypt using RAPD markers belonged to Ficus carica or to F. sycomorus. RAPD markers revealed a banding polymorphism sufficient for the distinction of the two Ficus species. Attempts to analyze the archaeological plant material were, however, unsuccessful, due to poor preservation of high molecular weight DNA and the presence of contaminants inhibitory to PCR.
Damasco et al. (1996) detected dwarf off-types in micropropagated Cavendish (Musa spp. AAA) bananas using RAPD markers. A RAPD marker specific to the dwarf off-type from micropropagation of Cavendish group cultivars New Guinea Cavendish and Williams was identified following an analysis of 57 normal and 59 dwarf plants generated from several micropropagation events. Of 66 random decamer primers used in the initial screen, 28.8 percent revealed polymorphism between normal and dwarf plants. Primer OPJ-04 (5’-CCGAACACGG-3’) amplified a 1.5 kb band which was consistently present in normal but absent in all dwarf plants of both cultivars. Reliable detection of dwarf plants was achieved using this marker, providing a suitable means of in vitro detection. Other micropropagation-induced RAPD polymorphism were not associated with the dwarf trait. Use of this marker could facilitate early detection and elimination of dwarfs from batches of micropropagated bananas, and may help to determine the factors responsible for dwarfing.
Tanaka and Yamaguchi (1996) reported that RAPD markers were found suitable for identifying true crossing in the breeding of tea (Camellia sinensis). RAPD markers were used to determine links between parents and their hybrid cultivars or clones. Results of studies on the cultivars ‘Yutakamidori’ and ‘Meiryoku’, for which percentage identification in registration documents was uncertain, suggested that ‘Yutakamidori’ is the result of chance outcrossing of ‘Asatsuyu’, and that ‘Meiryoku’, was not bred through a cross between ‘Yabukita’ and ‘Yamatomidori’, but instead through a cross with Z1.
Fingerprinting of bell pepper (Capsicum annuum L.) breeding lines was done using RAPD markers (Las et al., 1996). Of the 50 primers used, 42 showed bands in all the lines, while 8 failed to amplify. A total of 219 fragments were visualized across all 11 lines, and each primer produced approximately 5-6 fragments from each line. Of the 219 fragments, 144 were monomorphic (the band was present in all lines), 52 were polymorphic (the band was absent from at least one line) and 22 were unique to a single line. Only three of the 42 primers amplified a band unique to a single line. The percentage of bands common to all the lines was large (>50 per cent), indicating that the genetic base of the lines is very narrow. A cluster analysis was conducted on the basis of these data.
The genetic relatedness among 17 almond genotypes and one peach genotype was estimated using 37 RAPD markers. Genetic diversity within almond was found to be limited despite its need for obligate outcrossing. Three groupings of cultivar origins could be distinguished by RAPD analysis. A similarity index based on the proportion of shared fragments showed relatively high levels of 0.75 or greater within the almond germplasm. The level of similarity between almond and the peach was 0.424 supporting the value of peach germplasm to future almond genetic improvement (Bartolozzi et al., 1988).
RAPD analysis of olive (Olea europaea L.) cultivars was carried out by Fabbri et al. (1995) suggested a high degree of polymorphism in the germplasm examined. Forty random decamer primers were screened. Seventeen of these produced 47 reproducible amplification fragments useful as polymorphic markers. Each of the 17 cultivars was discriminated with a few primers. Results were analyzed for oil production and the cultivars and a cluster analysis was performed. These analyses revealed two main groups: one comprising primarily small-fruited cultivars grown mainly for oil production and the other characterized by having large fruit. There was no apparent clustering of olive cultivars according to their geographic origins.
Molecular characterization of common olive varieties in Israel and the West Bank using RAPD markers was carried out by Wiesman et al. (1998). Significant biodiversity was demonstrated among ‘Nabali’ olive trees growing along the central mountain ridge of West Bank, suggesting that the grouping known as ‘Nabili’ is actually a mixture of genetically distinct variants. On the other hand, RAPD profiles of selected variants of similarity, indicating that these variants represent environmental phenotypes of the same genome. Molecular differences were demonstrated between the ‘Nabali’ group variants and ‘Souri’. Other more recently developed or introduced varieties showed individually distinct RAPD profiles.
Genetic characterization of gooseberry germplasm was carried out by Lanham and Brennan (1999). RAPD, ISSR and AFLP markers were used to fingerprint and to examine genetic diversity among twelve genotypes of the gooseberry (Ribes grossularia subgenus Grossularia). AFLP generated unique profiles for each genotype. ISSR could not distinguish three of the genotypes, ‘Whinham’s Industry’ ‘Whitesmith’ and ‘Leveler’, whereas RAPD could not distinguish, ‘Whinham’s Industry’ and ‘Leveller’. Similarity matrices and dendrogram illustrated the genetic similarities between different genotypes but some clustering varied, depending on marker type that was being used. The results imply that the European cultivated gooseberry has a narrow genetic base and that further improvement to this crop species may require the introduction of additional germplasm into breeding programs.
Identification of raspberry cultivars by RAPD analysis was carried by Parent et al. (1993). A fast and simple test to accurately characterize the various cultivars of raspberry of the Quebee certification program was developed based on RAPD analysis using minute quantities of plant DNA. Portions of DNA are multiplied with small 10-nucleotide primers of arbitrary sequence. Analyses were carried out on DNA from 15 raspberry cultivars amplified with 19 different primers. A combination of three primers was chosen for its ability to differentiate all the cultivars. Test reproducibility was demonstrated using DNA samples from plants collected at various periods of the growth
Season and from plants of various categories of the certification program (in vitro plantlets, Foundation and Certified plants and commercial plants). Novy et al. (1994) clarified varietal misclassification and regional divergence in 22 cranberry varieties using RAPDs. Twenty-two decamer primers amplified 162 scorable DNA fragments, of which 66(41 per cent) were polymorphic. On the basis of these 66 silver-stained RAPDs (ssRAPDs), 17 unique profiles were identified rather than the expected 22. Fourteen varieties had unique ssRAPD profiles, while the remaining 8 were represented by three ssRAPD profiles. Permutational analyses of the data suggested that the observed ssRAPD profile duplications were examples of varietal misclassification. Further analysis identified two ssRAPD markers that were found only in Eastern varieties (from Massachusetts and New Jersey) and not in Wisconsin varieties. With varieties differing on an average by 22 bands, ssRAPDs were shown to be useful in varietal identification and the assessment of genetic diversity in cranberry.
Levi and Rowland (1997) identified blueberry cultivars and evaluated their genetic relationships using randomly amplified polymorphic DNA (RAPD) and simple sequence repeat- (SSR-) anchored primers. Fifteen highbush (or highbush hybrid) blueberry cultivars, two rabbiteye blueberry cultivars and one southern lowbush (Vaccinium darrowi) selection from the wild were examined using seventeen 10-base RAPD and seven 15-to 18-base SSR-anchored primers (primers comprised of SSR motifs) in polymerase chain reactions (PCRs). Fifteen RAPD and 3 SSR markers resulting from these reactions were chosen to construct a DNA fingerprinting table to distinguish among the genotypes included in this study. Similarity values were calculated based on 132 RAPD and 51 SSR band, and a dendrogram was constructed based on the similarity matrix. The V. ashei cultivars and the V. darrowi selection grouped out separately from the V. corymbosum cultivars as expected. However, estimates of relative genetic similarity between genotypes within the V. corybosum group did not agree well with known pedigree data and, thus, indicated that RAPD and SSR data did not accurately assess the genetic relationships of cultivars within this species.
Mori et al. (1993) characterized thirty-six and three introduced cultivars of Japanese potato using RAPDs. The RAPD patterns were highly reproducible and identical using DNA samples obtained from different locations and tissues (leaf or sprout). Five decamer primers amplified 15 useful DNA segments, which were polymorphic and common to all cultivars. All of the cultivars were clearly identified using RAPD markers. Description of cultivar identities by RAPDs was suggested for cultivar registration and in germplasm maintenance programs.
Identification of Cucurbitaceae cultivars was done using RAPD markers by Jeon et al. (1994). RAPD markers generated by six out of 50 arbitrary 10-mer primers were effective in discriminating nine Cucurbita moschata and six C. pepo, whereas 62.5 percent were specific to one or other spp. the rest were polymorphic in either or both spp. the average dissimilarity coefficient matrix of markers was 5.84 between C. moschata and C. pepo, it was 3.41 between two C. moschata cultivars and 2.90 between C. pepo cultivars. Fifteen Cucurbita cultivars screened were distinguished from each other by a single primer or by combinations of two or three primers.
Truksa and Prochazki (1996) reported potential use of RAPD markers in verification of cucumber hybrids. DNA from three lines used for production of hybrid seed was extracted and amplified by PCR with 60 random oligonucleotides as primers and with different thermo stable DNA polymerase. Amplified fragments were analysed on agarose gel. The RAPD markers obtained differed depending on the DNA polymerase used and had a relatively low degree of polymorphism. This low level of polymorphism indicated that RAPD was not suitable for verifying the hybridity of seed.
RAPD analysis was carried out in Chinese cabbage and other groups of Brassicas (Shu et al., 1995). Genomic DNA was studied by RAPD analysis amplified by means of a single primer(PII) in Brassica campestral sub-spp. chinensis and pekinensis and their related spp. and sub-spp. B. campestris var. rapa, B. japonica and B. oleracea var. capitata. The plant material shared common profiles of four fragments, PII 3, 13, 32 and 34. Fragments specific to the cabbage Jilin were PII 2, 18, 20, 21, 23, 25, and 33. Those specific to Chinese cabbage, turnip and B. japonica were PII 1, 10, 15, 19, 22, 24 and 30.
Rojas et al. (1994) reported RAPD markers and genetic polymorphism in tomato. Five tomato verities were analyzed using the polymerase chain reaction technique with arbitrary primers. The two primers used showed differences in the patterns obtained by means of genome amplification of the varieties.The Reverso primer with 16 bases showed greater intravarietal polymorphism than the universal primer with 17 bases. The value of RAPDs as genetic markers and for the detection of intravarietal polymorphism was assessed.
Boino et al. (1995) characterized tomato lines using RAPD-PCR and flow cytometry. Fifteen F1 hybrid lines and there parents were characterized. The RAPD-PCR analysis based on amplification of markers generated by random arbitrary 21-mer primers, allowed all but two of the lines to be distinguished. Flow cytometry detected individual differences in the DNA content of the majority of the lines. The two techniques were seen as complementary.
Tivang et al. (`1996) detected variation among and within artichocke (Cynara scolymus L.) cultivars and breeding populations using RAPD markers. The magnitude of genetic differences among the heterogeneity within globe artichoke cultivars is unknown. Variation among individual heads (capitula) from three artichoke cultivars and two breeding populations was evaluated using RAPD markers. One vegetatively propagated cultivar (Green Globe), two seed propagated cultivars (‘Imperial star’ and ‘Big Head’)) and two breeding populations were examined. Two to 13 polymorphic bands were observed for 27 RAPD primers, which resulted in 178 scored bands. Variation was found within and among all cultivars and breeding populations, indicating that all five groups represented heterogeneous populations.
The genetic relationships among individual genotypes were estimated using the ratio of discordant bands to total bands scored. Multidimensional scaling of the relationship matrix showed five independent clusters corresponding to the three cultivars and two breeding populations. The integrity of the five clusters was confirmed using pooled chi-squares for fragment homogeneity. Average gene diversity (Hs) was calculated for each population sample, and a one way analysis of variance showed significant differences among populations, while clonally propagated ‘Green globe’ and seed propagated ‘Imperial Star’ had the lowest Hs values. The RAPD heterogeneity observed within clonally propagated ‘Green Globe’ is consistent with phenotypic variability observed for this cultivar. Overall, the results demonstrate the utility of the RAPD technique for evaluating the genetic relationships and contrasting levels of genetic diversity among populations of artichoke genotypes.
Bradeen and Havey (1995) identified two inbreed lines of onion ‘Alisa Craig’ and ‘Brigham Yellow Globe’) using RAPD markers, demonstrated their Mendelian inheritance, and distinguished them. These analyses used only genetically characterized RAPD markers and revealed that contamination, in addition to drift and/or selection , likely contributed to differences among independently maintained, publicly released inbreds. However, RAPD markers did not distinguish confidently among four related inbreds.
A diagnosti9c test to confirm interspecific Allium hybrids using RAPD from crude leaf DNA extracts was carried out (Dubouzet et al., 1996). A crude extraction procedure for DNA was modified and used for small leaf samples (2-4 mg). Six random decamer primers (OPD 5, 7, 14, 15, 18, and 19) generated characteristic RAPD profiles from leaf DNA of Allium tuberosumcv. ‘Tender pole’ obtained using a crude micro extraction process. These RAPD profiles were roughly similar to those of DNA purified using an SDS extraction procedure. Crude extracts of leaf DNA were prepared from three accessions of ‘Tender Pole’, five ‘Yoshitake’ hybrids ( A. chinense ´ A. thunbergii) and seven putative trispecific hybrids between these two groups. DNA amplification with four random decamers (OPD 14, 15, 18 and 19) by PCR produced a total of 186 bands; of these, 54 were common bands found in both parents and the putative hybrid, 49 bands were found in the putative hybrid and the male parent only (M bands), 58 bands were found in the female parent and the hybrid plants, and 25 were unique bands found only in the hybrids. One of the seven putative hybrids have no M bands, indicating that it had no relationship to its putative male parent and that it may have been the product of an unwanted pollination.
Khandka et al. (1996) detected polymorphism and identified DNA markers for Asperagus cultivars identified using RAPD markers. DNA polymorphism among five asperagus (Asperagus officinalis) cultivars (‘Imperial’, ‘Snow’, ‘Steline’, ‘UC-157’ and ‘Larae’) were detected using thirty-one decamer primers, and twenty-six of them yielded amplification products. Among a total of 119 amplified fragments, 33 were polymorphic. These RAPD markers enabled the identification of asperagus cultivars and unique markers for cultivars were also identified. The pair wise marker difference between cultivars ranged from 0.08 to 0.17. A phenogram of the genetic relationship based on RAPD fits with the known origin of the cultivars.
In 1994, M. Javed Iqbal and A. Lane Rayburn used RAPD markers to determine cultivar specific DNA profiles in rye (Secale cereale L) using ten base primers. On comparison of amplification profiles of different rye cultivars using various primers, the overall profile was found to be cultivar specific. These primers appeared to amplify conserved sequences in all rye cultivars. In the cultivar Imperial, no polymorphism was observed among ten plants analyzed. They concluded that, despite the small amount of intracultivar variability, RAPD analysis has the potential to be a rapid method of cultivar identification in this out crossing species.
Katzir et al. (1996) found pronounced genetic differentiation between the 5-species of the parasitic weed broomrapes (Orobanche spp.) in agricultural fields of Israel and raised RAPD markers for identification of each of them. Parsimony analysis of 86 RAPD characters produced a tree which clearly distinguishes between the 5 species studied.
U. Galderisi et al. (1999) used RAPD analysis to distinguish six different cultivars of Ficus carica, and several other clones of Southern Italy, of which cultivars ‘Bianco del Cilento’ is particularly useful. To protect this useful cultivar molecular marker is used for accurate identification, to control the quality of products and prevent fraudulent commerce.
C.T. Federici et al. (1998) revealed the phylogenetic relationship within the genus Citrus (Rutaceae) and related genera by RFLP and RAPD analysis. The RFLP and RAPD data showed C. maxima was affiliated with the pepedus C. hongheensis and C. latipes, C. medica clustered with C. indica when only non-hybrid taxa were examined or among limes, lemons, and relatives when all species were considered.
Traditional pear cultivars in Xinjiang (China) were evaluated using RAPD markers and compared with representatives of Occidental pear species, cultivars of P. communis and East Asian pear accessions (Yuanwen Teng et al., 2001). UPGMA analysis of 72 pear accessions and 20 primers gave five main groups of pear accessions. RAPD data showed that some cultivars traditionally classified as P. bretschneideri should be assigned to P. sinkeangensis. Some cultivars like P. communis were found to be of hybrid origin of P. bretschneideri × P. pyrifolia. It was also confirmed that P. sinkiangensis is a hybrid origin.
Salih Kafkas et al.(2001) searched for RAPD markers linked to sex in Pistacia atlantica, P. terebinthus and P. eurycarpa, the main wild spp. in Turkey that are used as rootstocks for P. vera. A total of 472 primers have been screened and two bands, amplified by primers BC156 and BC360 to be sex associated in P. eurycarpa. The bands were tested in 30 male and 37 female individuals. Band BC156 was presented in all female trees except one and was absent from all the male trees. Band BC360 was amplified in 31 out of 37 females and was absent from all the males. In P. atlantica, one primer, OPA K09, amplified a female associated band (850bp), that was present in all 46 female individuals tested and absent in all the 38 male trees tested. They concluded that, it is likely that these markers are linked to sex determining loci.
2.7. Determining genetic purity
Varietal identification in Cichorium intybus L. and determination of genetic purity of F1 hybrid seed samples were done based on RAPD markers (Bellamy et al., 1996). RAPD markers were used to distinguish between several Cichorium intybus genotypes comprising four ‘White Witloof’ inbred lines, three ‘Red Witloof’ experimental inbred lines and a number of F1 hybrids derived from two white parents. Amplification conditions and reproducibility of RAPD patterns were examined. Comparison of PCR products obtained by using 100 10-merarbitrary primers allowed identification of all the lines analyzed. With several primers, line-specific RAPD markers were defined, while with others polymorphisms were more extensive, revealing several RAPD markers for several lines. All the differences were confirmed both on individual heads and young seedlings for each genotype. Because of the Mendelian segregation of these molecular markers, this method was applied to evaluate the genetic purity of F1 hybrid seed samples.
A study was conducted to determine the genetic purity of hybrid seed in watermelon (Citrullus lanatus) and tomato (Lycopersicon esculentum) using RAPD technique by Hashizume et al. (1993). To determine the genetic purity of hybrid seeds RAPD was employed to discriminate parents from their hybrids using a single primer for each reaction. Fifty-nine oligonucleotides were screened as primers for PCR in inbred parental line (Ha, Hb) currently used for commercial seed production in watermelon. Only 3 percent of the totally amplified DNA showed polymorphism, suggesting that there was a close relationship between the parents, RA 12-12(5’–ACCACCTGGCTC-3’), generated a product specific to the F1 and male parent(Hb), and enabled the female (Ha) to be discriminated from the hybrid.
In tomato, 12 primers were screened to discriminate two inbred lines, Morioka 20 (M) and Ottawa 48 (O), and four showed polymorphism. One out of four enabled the female line (M) to be distinguished from the F1 (M´O). Thirty primers were screened to segregate another pair of parents, O and Veeking (V), and five generated polymorphism. One of them enabled the F1 to be discriminated from O. Some four to seven percent of the total PCR products showed polymorphism, suggesting that there were close relationships among the parental lines. Using these primers, the conditions required for PCR and a method for DNA preparation were also studied. When 1-100ng of template DNA was used per reaction mixture, the electrophoratic pattern of the PCR product remained constant. When DNA prepared using a single method was used as template, the results were essentially the same as those obtained with the purified DNA.
Purity control of F1-hybrid tomato cultivars was done using RAPD markers (Rom et al., 1995). DNA from three commercial F1-hybrid cultivars (‘Naama’, ‘TY20’ and ‘5692’) and their parental lines were subjected to RAPD screening with 50 primers. Two of four primers which detected polymorphism between the parents tested, generated paternal-specific RAPDs, enabling a clear distinction to be made between hybrids and their maternal parents. In addition, combination of the polymorphic DNA products generated by these primers exhibited hybrid-specific patterns, enabling each cultivar to be identified. This result demonstrates the practical value of RAPD markers in hybrid-tomato-seed purity-control tests and cultivar identification. The approach is advantageous in its rapidity and simplicity, particularly as an alternative for those cultivars where lengthy and costly phenotypic tests are currently used.
Alice Le Due et al. used RAPDs to recognize Juniperus- pfitzeriana (Spath) Schmidt [Pfitzer Group] as the correct name for cultivars of Pfizer junipers. Juniperus × media, proposed by Van Melle (1947), was rendered illegitimate because of the earliear name J. media V.D. Dmitriev.
Walker et al. (1997) used isozyme and RAPD for analysis of Cheroke Rose and its putative hybrids ‘Silver Moon’ and ‘Anemone’. By RAPD-PGM analysis of 24 accessions of putative Cheroke Rose (Rosa laevigata Michx) hybrids ‘Anemone’ and ‘Silver Moon’ showed that ‘Anemone’ is likely to be such a hybrid but that ‘Silver Moon’ is not.
Yae et al. (1995a) classified forty apple cultivars by RAPD analysis using 16 random primers. Of the 139 clear and reproducible bands, 106 were polymorphic. From these polymorphisms the cultivars were divided into 6 groups by cluster analysis. Group I contained ‘Rall’s Janet’, ‘Fuji’ and the bud mutations of ‘Fuji’; group II contained ‘Sekaiichi’, ‘EarliBlaze’, ‘Delicious’ and its bud mutations; group III contained only ‘Indo; Gala’, ‘Mutsu’, ‘Jonagold’ and their strains formed group IV; ‘Jonathan’, ‘Jonared’, ‘Kogetsu’ and ‘Mollies Delicious’ formed group V; and group VI contained only ‘Spur Golden Delicious’.
Molecular classification of Malus was done using RAPD markers (Dunemann et al., 1994). The potential use of RAPD markers for taxonomic studies in Malus was investigated using sets of genotypes consisting of 20 wild spp. and 27 apple cultivars. DNA fingerprints generated with preselected random primers were analyzed for polymorphic amplification fragments, and coefficients estimating genetic similarity were calculated on the basis of about 50 polymorphic RAPD loci in each set of genotypes. Cluster analysis by an unweighted pair-group method with arithmetic average (UPGMA) revealed that, in cultivars, the molecular classification was in good agreement with the known lineage. A dendrogram generated for wild spp. gave relationships that were, in principle, in accordance with the known phylogenetic information. Closely related spp. from section I (Malus) was clearly distinguishable from those of sections III (Eriobolus) and IV (Chloromeles). A high degree of genetic diversity was found at the molecular level among both different apple cultivars and wild spp. of the genus Malus. The results gave additional evidence for the hypothesis that M. pumila and M. sylvestris were involved in the origin of the cultivated apples.
An examination of the ability of RAPD markers top determine the relationships within and between Rubus spp. was carried out by Graham and Mc Nicol (1995). RAPD markers were generated from 13 different Rubus spp. in order to assess the degree of similarity between spp. from the important subgenera Idaeobats, Eubats and Anoplobats. All ten primers revealed scorable polymorphisms within both the closely related and the genetically diverse individuals. Some 372 markers were generated and scored from the material analysed. Estimates of similarity, dendrogram and principle coordinate analysis (PCA) were calculated , with the results generally being in agreement with previous classification of the spp. studied, confirming the validity and usefulness of the RAPD method. However, amongst the spp. studied, R.. macraei (subg. Idaeobats) proved more diverse and grouped in with both the subgenera Idaeobats and Eubats at only 26 percent similarity.
RAPD analysis was carried out to evaluate polymorphism and genetic similarity between 39 Medeterrian mandarin genotypes. Some 111 amplification products were identified using 21 random primers. The average of 2.2 RAPD markers was obtained for each primer, corresponding to 42 percent of the amplification products. UPGMA cluster analysis revealed the low level of genetic variation between accessions of Medetterranean mandarins, whereas their hybrids with other citrus spp. showed greater genetic dissimilarity. Twenty accessions yielded very similar patterns, suggesting either that they could be a single clone, or that the technique was not able to detect genomic variation. However, for the other specimens genetic polymorphism was easily detected by RAPD, although the genetic variation between accessions was quite low. The large number of hybrids and the low level of polymorphism between accessions support the hypothesis that Mediterranean mandarins are all the true hybrids of common mandarins (Machado et al., 1996).
Graham et al. (1996 estimated genetic diversity in eight strawberry cultivars using RAPD markers. Ten random primers successfully amplified DNA fragments from each cultivar and specific fingerprints were generated from the molecular marker data. The cultivars were traced back to founding clones and the relationships between the cultivars were examined from both the molecular and pedigree data.
Feng et al. (1997) studied relationships among species in Morus L. using RAPD markers. Relationships among operational taxonomic units (12 species and 2 varieties) of Morus were examined with 20 random 10-mer primers, generating 238 polymorphic RAPD bands. According to dendrogram constructed using Nei’s genetic similarity values and an UPGMA program, M. notabilis was far removed from the other specie, indicating its unique differentiation. All groups were identical with morphological classifications, indicating the usefulness of RAPD for systematic studies.
Yang et al. (1995) reported an increase in polymorphism by using restriction fragment-random amplified polymorphic DNA (RF-RAPD) in Capsicum annum L. RF-RAPD analysis which uses DNA predigested with restriction enzymes, increases the detection of polymorphisms compared to normal RAPD analysis. Whilst RAPD analysis detects polymorphism at primer binding site, RF-RAPD detects polymorphism of restriction enzyme recognition sites in addition to primer binding sites. Nine additional polymorphic bands were detected between C. annum cv. ‘HDA210’ and C. annum var. fasciculatum cv. ‘Yatsufusa’ using RF-RAPD techniques employing five restriction enzymes in combination with six primers. Different primer – restriction enzyme combination produced different RF-RAPD bands. Inheritance of RF-RAPD markers agreed well with segregation data based on Mandelian genetics. This technique may be applied to increase the detection of polymorphism in genera with small amounts of genetic variation, and detected polymorphic bands could then be separated and used as RFLP probes.
RAPD analysis was used to evaluate the genetic distance among 43 accessions from 4 species of Capsicum and of diverse geographic origin. A total of 59 polymorphic fragments were generated by 35 primers and among them, 13 RAPD markers were uniformly present or absent in all the accessions belonging to C. annum. A sufficient degree of polymorphism was detected to differentiate among spp. C. annum, C. chinense and C. pubescent were more closely related to one another then to C. baccatum. Cluster analysis separated most genotypes of C. annum in to 2 main groups, except for Namjin, Hatvani and 3-25-27 which were each group seperatedly (Kang et al., 1997).
Comparison of isozyme and RAPD data was carried out to determine intraspecific variation in Cucumis (Staub et al., 1997). Variation at isozyme and RAPD loci in 8 cucumber (C. sativus) and 7 melon (C. melo) cultivars, breeding lines, and plant introduction were used to determine the utility of these markers for accessing genetic variation among population of each species. Although dendrogram derived from cluster analysis using species variation at marker loci were dissimilar, these disparities were consistent with differences in the pedigrees and/or other information (e.g., morphological) known about each accession and species. Empirical estimations of variances associated with each marker type in the cucumber and melon accessions examined indicate that, per band, lower coefficients of variation can be attained in the estimation of genetic difference when using RAPDs when compared to isozymes. The disparity between marker analyses made may be related to the amount of genome coverage characteristic of a particular marker system in a species and efficiency in sampling variation in a population.
Detection of genetic diversity was done using RAPD-PCR and sugar analysis of watermelon (Citrullus lanatus (Thunb.) Mansf.) germplasm (Lee et al., 1996). RAPD markers generated by 15 arbitrary decamers were used to determine the frequency of DNA polymorphism and in 39 watermelon germplasm. Of the 15 primer tested, all except one (primer 275) directed the amplification of polymorphic products. A total of 162 amplification products were generated across all 39 genotypes. Among the 162 fragments, 35 (21 per cent) appeared to be reliable polymorphic markers. The mean value by marker difference in this comparison was 0.24, and the highest, 0.69. From the phenograms constructed by UPGMA based on the comparison of RAPD markers, 4 clusters were resolved. Each group was also characterize and identified with morphological and genetic characteristic for each genotype. Results from the phylogenetic analysis of band sharing data were consistent with sweetness as measured by HPLC. In conclusion, RAPD assays can be used for providing alternative markers for identifying genotypes and quantitative characteristics (such as sweetness) in watermelon.
Samec and Nasinec (1996) reported the use of RAPD technique for the identification and classification of Pisum sativum L. genotype. The genomic DNAs of 42 Pisum sativum genotypes, representing 4 wild and cultivated subspecies were used as templates in RAPD reactions. Amplification with 8 decamer primers generated 149 polymorphic products. Genetic similarities of RAPD profiles were estimated via a coefficient of Jaccard and then the data were processed by cluster analysis (UPGMA). Each genotype was clearly identified and separated from the others. These results show that RAPD technology is a rapid, precise and sensitive technique for identification of pea genotype
Ren et al. (1995) determined identities and relationships among 52 germplasm accessions of Chinese vegetable Brassicas using 112 RAPD markers. The array of material examined spanned a wide range of morphological, geographical and genetic diversity, and included 30 accessions of Brassica campestris var. rapa, B. pekinensis, 18 accessions of B. juncea and 4 accessions of B. alboglabra.
The RAPD markers unambiguously identified all 52 accessions. Nei-Li similarities were computed and used in unwaited pair group method using arithmetic mean. (UPGMA) cluster analysis. Accessions and subspecies were clustered into groups corresponding to the three species, but some accessions of some subspecies were most closely related to accessions belonging to other subspecies. Values for Nei-Li similarities suggested that Chinese cabbage is more likely to have been produced by hybridization of turnip and pakchoi then as a selection from either turnip or pakchoi alone. RAPD markers are a fast, efficient method for diversity assessment in Chinese vegetables brassicas that complements techniques currently in use in genetic resources collections.
Lanner et al. (1996a) determined genetic validity of RAPD markers at the intra and inter specific levels in wild Brassica species with n= 9. The sequence homology of co-migrating RAPD markers within a genus, across species, and among populations of a species investigated. DNA was isolated from 10 wild Brassica species with n=9 and the RAPD patterns were established using 3 random primers. The wild species studied were Brassica bourgeaui, B. cretica, B. hilarionis, B. incina, B. insularis, B. macrocarpa, B. montana, B. olerecea, B. rupestris and B. villosa. 5 RAPD markers which appeared to be characteristics for the n=9 species ( genus level), 4 markers which appeared to be species specific , and one population specific marker were isolated from agarose gels and hybridized to the RAPD profiles of the 10 Brassica species. 2 RAPD markers were cloned for comparison with gel isolated RAPD fragment probes in hybridization experiments. Non specific and background hybridization, occurring when gel isolated fragments were used as probes, disappeared when cloned fragments were used. A total of 250 RAPD marker hybridizations were scored according to visual presence or absence in a gel lane. All except 3 markers hybridized as expected, resulting in an error rate of 1.2 per cent. The deviating results included a lack of hybridizations although a band was visible in the gel, a length polymorphism for one marker, and a dual hybridization signal for two single band markers.
Lanner et al. (1996b) estimated diversity in natural populations of wild Brassica oleracea using isozyme and RAPD analysis. Naturally occurring populations of wild Brasicca oleracea were collected in Spain, France and Great Britain. Allele frequencies at 4 isozyme loci were determined for 18 populations, while 5 populations were screened using 5 random primers to generate RAPDs. Levels of homozygosity and gene diversity, H, were computed for each population using isozyme data and RAPD data when applicable. Homozygosity levels tended to be higher in smaller populations, which could also be observed as increased numbers of homozygous loci in smaller populations. Gene diversity values based on isozyme indicated considerable within population variation regardless of population size.
The RAPD based gene diversities were significantly higher and the two exceptional populations display diversity levels more in keeping with the rest. The coefficient of gene differentiation, GST (genetic diversity subtotal), for populations in each region showed that the Spanish populations were more homogeneous then the French and the British populations. When the GST for all populations was calculated using isozymes vs. RAPD data, the RAPD data gave a significantly lower value, a plausible results of the higher within population variation detected using RAPDs. Genetic distances between populations from different regions were also calculated from both data sets and used to produce phenograms. Clustering according to geographical regions was not evident using either isozyme or RAPD data.
Mass and Klaas (1995) determined intra specific differentiation in garlic (Allium sativum L.) using isozyme and RAPD markers. Garlic Allium sativum is a sterile species of considerable variability with respect to morphological and physiological features. The crop presumably originated in western to central Asia from its progenitors A. longicuspis and was transported from there to the Mediterranean and other area of cultivation. In order to clarify older classification schemes, often based on small or biased collections, isozymes and RAPD markers were studied in a collection of 300 accessions, many of which were gathered in central Asia close to the assumed center of origin. All of the accessions were first investigated with isozymes, and 48 were selected for a RAPD analysis.
The resulting molecular markers were used to construct neighbors joining dendrogram to group the accession and indicate the genetic distances between them. Based on the dendrogram and in conjunction of some morphological features, an intra specific classification of garlic with 4 major groups is proposed. In agreement with the results of other workers, A. longicuspis lies within the range of the species A. sativum. Numerous forms with varying degrees of domestication are part of the longicuspis group, from which presumably the more derived cultivar groups originated. The origin and spreading of the crop are discussed with respect to the geographical distribution and the genetic distances of the accessions.
Assessment of genetic relationships among sexual and asexual forms of Allium cepa was done using morphological traits and RAPD markers (Thierry et al. 1997). Allium cepa included 2 major crops on the basis of morphological traits and typical reproduction mode: sexually reproduced biennial onions and vegetatively propagated perennial shallots, which rarely flower. In addition the seed propagated shallot, a recently released variety with intermediate phenotype for life history, have been described and used by breeders. A joint analysis RAPD markers and morphological characters were undertaken for the assessment of genetic diversity and crop classifications among Allium cepa genotypes.
A morphological study describing growth and development was carried out on a nested sampling (34 accessions) from 2 geographical origins (European or tropical) and of different plant status (improved varieties or local ecotypes). 4 primers reproduced 24 reproducibly scorable DNA bands, which gave individual finger printing for representative accessions of both onion and shallots. The results indicate that the seed propagated shallots is more closely related to onion then to vegetatively propagated shallots and , moreover, reveal a geographical structure of genetic diversity.,
Karihaloo et al.(1995) reported RAPD variation in the egg plant , Solanum melongena L. (Solanaceae). RAPD analysis was carried out on 52 accessions of Solanum melongena and 25 collections of the related weedy form known as forma insanum. 22 primers amplified 130 fragments. S. melongena exhibited 117 of the fragments, all of which were also present in insanum. Insanum displayed an additional 13 fragments not found in sub-species na. Overall, the insanum accessions were more diversed then those of S. melongena were. The calculated similarities between them were 0.95. The RAPD results were closely concordant with the results of a previously published electrophoratic isozyme survey [Theoretical and Applied Genetics (1995) 90, 578 to 583] performed on the same accessions. The similarity of the result showed that even though S. melongena and F. insanum are highly diverse morphologically. It is no longer appropriate to distinguish them taxonomically.
A study was carried out to differentiate nearly identical germplasm accessions by a combination of molecular and morphological analysis by Waycott and Fort (1994). PCR based RAPD markers were used to study the extent redundancy (duplication of genetic materials) within a germplasm collection. 9 nearly phenotypically identical accessions of butterhead lettuce (Lactuca sativa) were assayed for their genetic identities. A non uniform, heterogeneous butterhead line and a crisp head cultivar were added for population comparison. PCR amplification using 13 oligonucleotide primers generated 93 polymorphic bands. The percentage of segregation bands was used to determine within line variation; values ranged from 0.0 to 12.0 per cent, except for the non uniform line at 22.6 per cent. Between line similarity was measured using similarity coefficients and ranged from 0.919 to 0.985.
The relationship between the crisphead accessions and a composite of all butterhead accession was 0.84. Self progeny of each line was measured for morphological uniformity. The variation obtained from the data was compared with variation detected with the DNA level and each was positively co-related. Results demonstrated that RAPD analysis may serve as a major source of information for separation of closely related accessions, especially when integrated with phenotypic measures.
Yang et al. (1995) characterized celery genome using DNA based genetic markers. To characterize the celery (Apium graveolens var. dulce, 2n=2x=22) genome, 126 celery cDNA clones and 340 random 10–mer primers were used to generate RFLP and RAPD markers between two cultivated types. Different abundance classes of the genomic sequences represented by the cDNA clones and the RAPD markers were observed. Most of the cDNA clones were single copy sequences, suggesting the true deployed nature of the celery genome. Nearly half of the 39 RAPD markers tested by southern hybridizations were multiple copy sequences. Of the RAPD markers tested, 28 per cent were single – and low – copy, and 26 per cent were high- copy sequences. The polymorphism of the cDNA clones was 23 per cent when tested for 4 restriction enzymes (Eco RI., Eco RV, Hind III and Hae III).
The positive association was observed between RFLP level and the size of cDNA inserts or hybridized restriction fragments. Deletion, insertion and base substitution were important in the formation of the RFLP markers. Eighty two (23 per cent) of the 340 primers tested yielded useful RAPD markers, but only 3.8 per cent of the amplified products were polymorphic. Base substitution may be the most important mechanism for the RAPD markers in celery. The RAPD fragments revealed no RFLP markers when tested by southern hybridization, implying that RAPD markers are an important compliment to RFLP markers in genomic mapping in celery. Random methylation of cytosine was determined in 5S rDNA on Ban HI and Hind III cutting sites that produced ladder patterns characteristic of tandem repeats.
D.P.Prakash et al. (2002) used RAPD markers to estimate molecular diversity of 41 genotypes of Guava. They extracted DNA by CTAB method for PCR amplification and obtained 93 amplified fragments from eight random 10-mer primers. The genetic dissimilarity matrix calculated based on Squared Euclidean Distance showed maximum genetic distance of 54 per cent and minimum of 11 per cent. Cluster analysis by Wards method showed two major clusters based on there geographical location and species. Their study showed that the genetic base of Indian Guava are not genetically identical and have independent origins.
Hallden et al. (1994) evaluated and compared RFLP and RAPD markers for their ability to determine genetic relationships of a set of three Brassica napus breeding lines and found that the RFLP and RAPD markers set detected similar relationships among the three lines with known pedigree data. Also RAPD markers have the same resolving power as RFLP markers when used to same B. napus genotype. They suggested that RAPD markers are easier and quicker to use so these may be preferred.
F. J. Gallego and I. Martinez (1996) used RAPD technique using twenty 10-mer primers to amplify genomic DNA from 25 cultivars of rose. The data obtained revealed no variability within cultivars and a high degree of variation between cultivars. All the rose cultivars were unequivocally identified with the pattern obtained with two of the primer (OPA-11 and OPA-17). The results suggest that RAPD profiles provide a simple and efficient way to identify rose cultivars.
Anik Luke Dhanaraj et al. (2002) used RAPD markers to estimate the diversity among 90 Cashew accession from the National Research Centre for Cashew, Puttur, Karnataka, India. Dendrogram constructed by Wards method, Squared Euclidean Distance confirmed that the diversity of Indian cashew collected can be “moderate” to “high”. They identified a core collection based on the study which represents the same diversity as the entire population.
F. Gutman et al. (2001) used RAPD analysis to fingerprint 29 genotypes of Cereus spp. and examined their genetic diversity. A dissimilarity matrix and dendrogram were constructed to visualize genetic relationships between different genotypes. The results showed that C. peruvianus has only a limited genetic base and that further improvement of this crop may require the introduction of additional germplasm into breeding programs. They found RAPD markers to be a valuable tool for clone identification in Cereus spp. and for determining genetic relationships.
RAPD markers were used to determine genetic diversity within and between populations of Cashew (Anacardium occidentale L.) grown on different geographical locations around the world and within the pool of 20 elite Tanzanian cashew lines (Emmarold E. Mneney et al. (2001). The RAPD profiles revealed a high degree of DNA level similarity between the Tanzanian accessions. Accession from India, Mozambique and Tanzania showed the closest relationship, with accession from Brazil being the most distinct from the other provinces. A specific RAPD-PCR product was linked with cashew accessions from the Cook Islands.
Mei Li and Midmore (1999) estimated the genetic relationships of Chinese water chestnut (Eleocharis duleis (Burm.F.) Hensch) cultivated/introduced in Australia using RAPD. They suggested that the observed morphological and physiological variation of Chinese water chestnut cultivated in Australia with that of China is due to differences of environment and cultivation rather than genetic diversity.
Leaves of 22+17 accessions of Olive (Olea europea L.) were obtained from Israel, Italy, USA and Australia and their genetic variability was studied by RAPD (Genet. T. Mekuria et al., 1999). UPGMA clustering showed that ‘Manzanillo’ and ‘Kalamata’ showed a within cultivar genetic similarity, ‘Verdale’ showed a high genetic variability with some accession, ‘Picual’ and ‘Mevadillo’ are possibly distinct cultivars.
Sunil Archak et al. (2001) identified molecular markers for exploring the genetic diversity and developed molecular profiles for identification of Cashew in India from National Cashew gene bank collections by RAPD and AFLP techniques. Fifty selected random RAPD primers generated 564 bands of different sizes ranging between 220 bp and 3 kb with a mean of 11.3 bands/primer. Average Jaccards Similarity Co-efficient (JSC) was 0.528 and the range was 0.454. in AFLP analysis six primer pairs generated 456 bands of sizes ranging from 50 bp to 500 bp in the 19 accessions, with a mean of 76 bands/ primer pair. All the bands were polymorphic. Average JSC was 0.346 and the range was 0.708. They observed significant correlation coefficient between similarity matrices and cophenetic matrices derived from RAPD and AFLP techniques were 0.310 and 0.306 respectively and were statistically similar. They explained the variability expressed in the form of JSC and mean mark diversity by saying that Cashew is an allogamous tree species and only a part of gene pool is expected to be in India. Due to the seed propagation of plants, it resulted in high variability between individuals within the available gene pool.
Materials
And
Methods
The study was conducted at Plant Molecular Biology Laboratory, Division of Horticulture, GKVK, UAS, Bangalore to obtain fingerprint of open pollinated progeny of Mallika variety of Mango and compare/relate it with other open pollinated progenies of same mother plant by preparing a Dendrogram.
3.1. Plant material
The leaf samples of all mango cultivars studied in this research were obtained from the orchards of Division of Horticulture, GKVK, UAS, Bangalore. The leaves collected were sealed in the brown paper covers. Then the leaves were oven dried in the laboratory. The required amounts of leaves are powdered and the remaining leaves are sealed in poly bags. Recently mature leaves were used for the isolation of DNA.
3.2. Sample preparation
The leaf samples for DNA extraction were prepared according to Tai and Tanksley (1990) with some modifications. Recently mature leaves were collected and dried at 40°C for 48 hours. The dried leaves were powdered using a ‘Remi’ mixer for 45 to 60 seconds. The dried leaves can be stored in sealed polyethene bags for over three months.
3.3. DNA extraction protocol
To obtain fine powder, the powdered leaf sample was filtered using a 60-mesh sieve. Porebski et al., (1997) protocol using CTAB method (Dellaporta, 1983) with slight modification was followed. The standardized protocol for DNA extraction from mango leaf followed is given below:
1. To 500mg of ground leaf tissue, 20ml of extraction buffer (containing 3 per cent CTAB, 100mM Tris, 20mM EDTA, 1.4M NaCl, 2 per cent PVP and 1 per cent b-Marceptoethanol) which was preheated to 65°C was added.
2. The tube containing the buffer and powdered leaf tissue was incubated for one hour at 65°C with intermittent shaking.
3. It was brought to room temperature and 6ml of CHCl3: Isoamyl alcohol (24:1) was added to the tube, which was mixed well for 25-30 times by inverting the tube gently and spun at 6000 rpm for 10-15 minutes.
4. The supernatant was transferred to a fresh tube. This step was repeated to get a clear supernatant.
5. ½ volume of 5M NaCl was added and mixed well and to which 1volume of ice cod Propanol was added and left at 4°C overnight for precipitation of DNA.
6. The eppendorf tube was spun at 9000 rpm for 25 minutes. The supernatant was poured off and the DNA pellet was washed with 70 per cent ethanol and dried in a Vacuum drier.
7. The DNA was suspended in 300ml of TE (Tris-EDTA) buffer and transferred to an eppendorf tube.
8. 3ml of Rnase enzyme (1mg/ml) was added and incubated at 37°C for overnight.
9. 300ml of phenol was added, mixed well and spun at 5000rpm for 5-10 minutes and the supernatant was transferred to another eppendorf tube.(The temperature of the centrifuge was maintained above 20°C).
10. 300ml of Phenol: Chloroform (1:1) was added to it, mixed well and spun at 5000rpm for 5minutes and the supernatant was transferred to another eppendorf tube.
11. 300ml Chloroform was added, mixed well and spun at 5000rpm for 5 minutes and the supernatant was transferred to another eppendorf tube.
12. 1 volume of Prapanol was added to precipitate DNA. The tube was left at -20°C for overnight for fastening the precipitation.
13. The eppendorf tube was spun at 10,000 rpm for 20 minutes.
14. The DNA pellet was washed with 70 percent ethanol and dried. The pellet was resuspended in 300ml TE (Tris-EDTA) buffer.
15. 1/10th volume of 3M Sodium Acetate was added, mixed and spun at 5000rpm for five minutes. Finally the supernatant was transferred to another eppendorf tube.
Finally the quality and quantity of DNA was verified by electrophoresis on a 1.2 per cent Agarose gel.
3.4. DNA amplification protocol
The protocol suggested by Williams et al. (1990) for PCR was followed with slight modifications as follows:
1. The working table was sterilized with Ethanol. The PCR tubes were labeled and template DNA (5-25hgms) were added to the bottom most portion of the PCR tube.
2. Primer (2.5ml) was added then. The four different primers used are OPA –01, OPB-01, OPC-12, OPD-07.
3. Double distilled sterile water (7.5ml) was added next.
4. 10ml Cocktail (200mM DNTPs + 1 unit Taq polymerase + 1X buffer + 2mM MgCl2 in 25 ml of Cocktail + water) was added.
5. One drop of Mineral oil was added at last on the top of PCR tube to prevent the evaporation of reaction mixture.
6. The PCR tubes were then centrifuged for 1-2 minutes at 4°C. PCR tubes should be kept at ice bath while proceeding with the above procedures.
7. Then the PCR tubes were closed and placed in a thermal cycler for amplification programmed as follows for 45 cycles:-
Initial denaturation at 94°C for 20 seconds,
Then annealing at 55°C for 20 seconds, and
Then extension for 30 seconds at 72°C
3.5. DNA electrophoresis
Separation of amplified DNA fragments was carried out on 1.2 per cent agarose gel (polysaccharide derivative of agar} stained with Ethidium bromide. The microscopic pores in the agarose gel acts as a molecular sieve. Running buffer, which contained Tris-HCl, boric acid and 0.5M EDTA (pH 8.0) was used for electrophoresis and for preparing gels. Wells were loaded with 25µl of PCR mixture and 5µl of loading buffer (Sucrose, Xylene cyanol, Bromo phenol blue) together. Electrophoresis was conducted at 45 V for 8-10 hours and the gel was photographed under UV light.
3.6. DNA analysis
Bands were manually scored 1 for presence and 0 for absence and the binary data were used for stastical analysis by using the software “STASTICA-CLUSTER ANALYSIS”. The sizes of the fragment (molecular weight in base pairs) were estimated by using 100 bp ladder marker, which was run along with the amplified products. A genetic dissimilarity matrix was calculated according to Squared Euclidean Distance which estimated all pair-wise differences in the amplification product and Cluster analysis was done by Wards method using a minimum variance algorithm (Ward, 1963).
Result
CHAPTER 4
RESULTS
The results of the study title “RAPD characterization of open pollinated progeny (2/8) of Mallika mango (Mangifera indica. L)” are presented in this chapter under the following headings:
4.1 Extraction of the genomic DNA from the open pollinated progeny (2/8) of Mallika mango.
4.1 (a) Sample preparation
The recent matured leaves of the open pollinated progeny (2/8) of Mallika mango were collected from the orchards of Gandhi Krishi Vigyan Kendra, IIHR, Bangalore. They were packed in brown paper covers and brought to laboratory. They were dried in the Hot air oven at a temperature of 40˚C for 48 hrs. by spreading them evenly. The dried leaves were powdered in a ‘Remi’ mixer. Powdering of 5g leaf tissue yielded around 1.5g of fine powder after passing through 6-mesh sieve.
4.1(b) DNA isolation
The DNA was isolated from the powdered leaf sample by CTAB method as mentioned in “Materials and method” chapter. The DNA digested from the enzymes indicated that the method resulted in production of good quality DNA. (Fig. 1)
4.2 Amplification of genomic DNA obtained.
The basic protocols described by Williams et al.(1990); and Welsh and Mc Clelland(1990) for PCR were followed with slight modification. Amplification conditions for each cycle of PCR consists the following steps which are repeated for 45 times:
· Denaturation at 94˚C for 1 minute.
· Annealing at 35˚C for 1 minute.
· Extension at 72˚C for 2 minutes.
For PCR reaction the extracted DNA is diluted to1:20 ratios by adding 10µl of double distilled water. The amplified DNA was again subjected to agrose gel electrophoresis to obtain DNA profiles.
4.2(a) Primer selection
In the study four random Operon decamer primer namely OPA-01, OPB-01, OPC-12, OPD-07 were used. The bands ranged from 1500bp to 600bp. All the primers produced intense bands. While OPA-01 and OPB-01 produced two each of faint bands. OPC-12 gave maximum number of bands (i.e. 5) between 700bp to 1500bp, OPB-01 and OPD-07 produced only two bands. The DNA profile obtained for four primers showed 10-polymorphic band and one monomorphic band of 1300bp (Fig. 2).
4.2(b) Pattern of Genetic diversity and relatedness between open pollinated progeny of Mallika mango.
The DNA profiles obtained for 2/8 were scored along with the other profiles obtained in other progenies and a Dendrogram or Dissimilarity matrix was developed using Squared Euclidean Distance and Clustering based on Wards method.
In the Dendrogram, all the 12 varieties were distinctly divided into two major clusters ‘A’ and ‘B’ at 11 units (Fig. 3). Variety 5/12 and 1/8 spanned the extremes of the entire dendrogram. Genetic dissimilarity ranged from a lowest of 0(zero) (between 3/4 and 2/4) to a highest of 11 (between 1/8 and 5/11 or 5/4).
Variety 1/8, 10/8, 2/4, and 3/4were assigned to cluster ‘A’. Genetic dissimilarity among the entries in this cluster ranged from a lowest of 8.33 per cent( between 2/4 and 3/4) to a highest of 40.83 per cent( between 1/8 and 3/4 as well as 1/8 and 2/4).
The other cluster ‘B’ comprised the largest number (8) of accessions. In this cluster variety 8/11, 5/4, 5/11, 7/4, 4/14, 10/15, 2/8, 5/12 is grouped together. The genetic dissimilarity in this group was ranging from 0 per cent between 5/4 and 5/11 to a high of 41.67 per cent between 8/11 and 10/15.
Group ‘B’ was further divided into sub clusters ‘B-I’ and ‘B-II’ at 7 units in the dendrogram. Varieties 4.14, 7/4, 5/11/ 5/4 along with 8/11 formed a sub cluster ‘B-I’. Varieties 5/12 and 2/8 along with 10/15 formed a sub cluster ‘B-II’.
From the clustering in the dendrogram, it was evident that cluster ‘A” are less diverse as compared to cluster “B”.
|
Primer number |
Nucleotide sequence (5’ to 3’) |
Total number of fragments amplified |
|
OPA-01
OPB-01
OPC-12
OPD-07 |
CAGGCCCTTC
GTTTCGCTCC
TGTCATCCCC
TTGGCACGGG |
4
2
5
2
|
|
4 |
|
13 |
Table 1. Synthetic deoxyribonucleotides used as primers for amplification of open
pollinated progeny of Mallika mango DNA.

Fig. 1: Agarose gel electrophoresis of the genomic DNA extracted from open
pollinated progeny (2/8) of Mallika Mango.
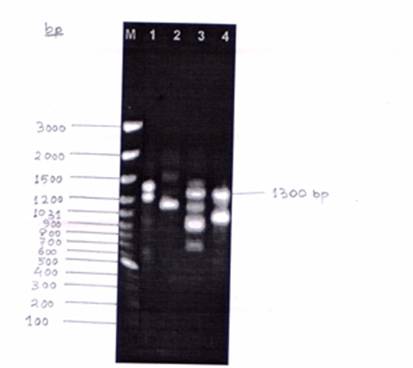
Fig 2: RAPD profile of open pollinated progeny (2/8) of Mallika as produced
by the Operon Primers (lane 1: OPA-01; lane 2: OPB -01; lane 3: OPC-12;
lane 4: OPD-07 and M: 100bp DNA marker).
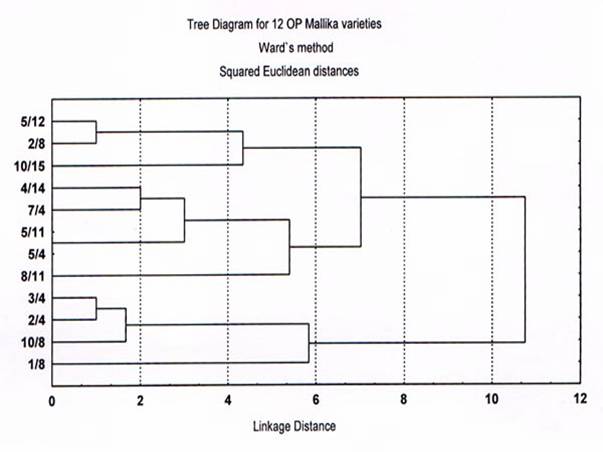
Fig.3: Dendrogram for 12 open pollinated progeny (2/8)of mango variety
“Mallika” as revealed by RAPD markers.
Discussion
CHAPTER 5
DISCUSSION
The recently matured leaves of the open pollinated progeny of Mallika mango are packed in a brown paper covers and brought to laboratory. They were dried in the hot air oven at a temperature of 40˚C for 48 hours by spreading them evenly. Prolonged drying of the samples may result into degraded DNA (Wilfinger, 1999). Leaves dried for 48 hours were optimal for powdering the leaf samples in a ‘Remi’ mixer. The remaining leaf powder could be stored by sealing in polybags for two months, but the leaf powder could not be stored for long time (N.V.Hemantkumar et al., 2001).
The DNA was isolated from the powdered leaf sample by CTAB method as mentioned in “Materials and method” chapter. The DNA digested from the enzymes indicated that the method resulted in production of good quality DNA.
The basic protocols described by Williams et al. (1990); and Welsh and Mc Clelland (1990) for PCR were followed with slight modification. Amplification conditions for each cycle of PCR consists the following steps which are repeated for 45 times:
· Denaturation at 94˚C for 1 minute.
· Annealing at 35˚C for 1 minute.
· Extension at 72˚C for 2 minutes.
For PCR reaction the extracted DNA is diluted to1:20 ratios by adding 10µl of double distilled water. The DNA is diluted since too much DNA produced a smear effect which creates problem in identification of bands and so comparing them. The amplified DNA was again subjected to agarose gel electrophoresis to obtain DNA profiles.
In the study four random decamer primers viz. OPA-01, OPB-01, OPC-12, OPD-07 were used which gave bands ranging from 1500bp to 600bp. All the primers produced intense bands. While OPA-01 and OPB-01 produced two each of faint bands. The brighter band shows that the sequence is repeated in the genome while the lighter bands shows that the sequence is least repeated in the genome. OPC-12 gave maximum number of bands (i.e. 5) between 700bp to 1500bp, OPB-01 and OPD-07 produced only two bands. The DNA profile obtained for four primers showed 10-polymorphic band and one monomorphic band of 1300bp (Fig. 2).
In the dendrogram of twelve open pollinated progenies of Mallika, two major clusters were obtained which may be due to the variation in the male plant fertilizing the mother Mallika plant.
In the dendrogram, progeny 5/4 and 5/11 gave the least genetic distance of zero. The reason might be possible fertilization of mother Mallika plant by pollen of same plant or it might be obtained due to the use of less number of primers and use of more number of primers may possibly show variation among them.
The maximum genetic distance was found between progeny 1/8 and 5/4 or 5/11 so this progenies can be chosen in plant breeding experiments to produce hybrid plants. The dissimilar progenies are selected in plant breeding experiments to produce hybrids which will yield hybrid vigor, high production. The narrow bases i.e. progenies with lesser genetic distance; should be never selected for production of hybrids as they will led to inbreeding depression.
Summary
CHAPTER 6
SUMMARY
Mango is one of the most popular and choicest fruit of India and so an important fruit crop of India. Due to the availability of various varieties of mango saplings in market which looks similar, it is difficult to identify a pure variety on the basis of morphological markers. Since the mango plant will take four years to grow, fruit and only then the quality and purity of the variety can be identified. This problem can be solved by comparing the genetic profile with the recorded gene profile of the mango varieties within two weeks. So here we found out the gene profile data of open pollinated progeny of Mallika and genetic diversity is found out between 12 open pollinated progenies of Mallika.
The salient features of the findings are as follows:
1) In this study, genetic profile of the open pollinated progeny (2/8) of Mallika mango was accomplished.
2) The genetic profile of open pollinated progeny (2/8) of Mallika was obtained by using four primers OPA-01, OPB-01, OPC-12, and OPD-07. The profile obtained for progeny (2/8) was compared with other eleven progenies and genetic diversity is obtained by preparing Dendrogram using Squared Euclidean Distance and Clustering based on Wards method.
3) It was found that Progeny (2/8) is closely related to progeny (5/12) and is most dissimilar with progeny(1/8).
References
Chapter 7
REFERENCES
ALICE, LE, DUE., ADAMS, R. P. AND ZHONG, M. (1999). Using Random amplified polymorphic DNA for a Taxonomic Reevaluation of Pfitzer Junipers. Hort. Science; 34(6):1123-1125.
ANONYMOUS (2001). Horticulture crop Stastics of Karnataka State at a Glance, Director of Horticulture, Lalbaug, Bangalore.2001; 69.
ANONYMOUS, Food and Agriculture Organization of the United Nations. Production Yearbook 41, Food and Agriculture Organization, Rome. (1987).
ANONYMOUS, http://opbs.okstate.edu/~melcher/MG/MGW1/MG11127.html
ANONYMOUS, http://rucus.ru.ac.za/~wolfman/Essays/PCR2.html
ANONYMOUS, http://www.nal.usda.gov/ttic/tektran/data/000007/02/0000070289.html
ANONYMOUS, http://www.ndsu.nodak.edu/instruct/mcclean/plsc731/mapping/mapping1.htm
ARCHAK, S., BALDEV, A., GAUTAM, D., AND KARIHALOO, J, L. (2001). Characterization of Genetic Diversity of Cashew (Anacardium occidantele L.) in India by RAPD and AFLP analysis. Indian Journal of Plant Genetic Resources, 14(2): 255-257.
BARTOLOZZI, F., WARBURTON, M, L., ARULSEKAR, S. AND GRADZIEL, T, M., (1998). Genetic characterization and Relatedness among California Almond cultivars and Breeding lines detected by RAPD analysis. J. Amer. Soc. Hort. Sci., 123(3): 381-387.
BELLLAMY, A., VEDEL, F. AND BANNEROT, H., (1996). Varietal identification in Cichorium intybus L. and determination of genetic purity of F1 hybrid seed samples, based on RAPD markers. Plant Breeding, 115(2): 128-132.
BOIANO, S., COTTONE, C., VISCARDI, M., D-APICE, L., SPIGNO, P., ROSA, G, D., CAPPARELLI, R., IANNELLI, D., NOVIELLO, C. AND DE, R, G., (1995). Characterization of tomato lines using RAPD-PCR and flow cytometry. Annali-della-Facolta-di-Scienze-Agrarie-della-Universita-degli-Studi-di-Napoli,-Portici, 29:68-83.
BRADEEN, J, M. AND HAVEY, M., (1995). Randomly amplified Polymorphic DNA in bulb onion and its use to access inbred integrity. J. Amer. Soc. Hort. Sci .,120(5): 752-758.
CAETANO-ANOLLES,G.(1998) The.DNA.kaffe http://biologi.uio.no/FellesAvdelinger/DNA_KAFFE/Kaffe.html
CHADHA, K, L. AND PAL, R, N., (1986). In: Mangifera indica, pp: 211-230, Ed. A. H. Halevy, CRC handbook of flowering. 5. CRC press, Boca Raton, Fla.
CHENG, F, S., WEEDEN, N, F. AND BROWN, S, K., (1996). Identification of co-dominant RAPD markers tightly linked to fruit skin color in apple. Theor. Appl. Genet. 93(1-2): 222-227.
CONGIU, L., CHICCA, M., CELLA, R., ROSSI, R., BERNACCHIA, G. (2000) The use of RAPD markers to identify strawberry varieties: a forensic application Molecular Ecology., 9: 229-232.
DAMASCO, O, P., GRAHAM, G, C., HENRY, R, J., ADKINS, S, W., SMITH, M, K. AND GODWIN, I, D., (1996). Random amplified polymorphic DNA (RAPD) detection of dwarf off-types in micro propagated Cavendish (Musa spp. AAA) bananas. Plant Cell Reports, 16(1-2): 118-123.
DHANARAJ, A. L., BHASKARA RAO, E. V. V, SWAMY, K. R. M., BHAT, M. G., THEERTHA PRASAD, D., AND SONDUR, S. N (2002). Using RAPDs to assess the diversity in Indian cashew (Anacardium occidentale L.) germplasm. Journal of Horticultural Science and Biotechnology. 77(1): 41-47.
DUBOUZET, J, G., ETOH, T., ARISUMI, K. AND YOSHITAKE, T., (1996). A diagnostic test to confirm interspecific Allium hybrids using random amplified polymorphic DNA from crude leaf DNA extracts. J. Japanese Soc. Hort. Sci., 65(2): 321-326.
DUNEMANN, F., SCHMIDT, H(ED.). AND KELLERHALS, M., (1994). Molecular classification of Malus with RAPD markers. Development in Plant Breeding, 1: 295-300.
ELLEN THRO (2000). Genetic Fingerprinting- DNA in the courtroom, Genetic Engineering –Shaping the material of Life .Ed. 1: 57-66.
FABBRI, A., HORMAZA, J, I. AND POLITO, V, S., (1995). Randomly amplified Polymorphic DNA of Olive (Olea europaea L.) cultivars. J. Amer. Soc. Hort. Sci. 20(3) 528-542.
FEDERICI, C. T., FANG, D. Q., SEORA, R. W., ROOSE, M. L (1998). Phylogenetic relationships within the genus Citrus (Rutaceae) and related genera as revealed by RFLP and RAPD analysis. Theor. Appl. Genet, 96:812-822.
FENG, L., YANG, G., YU, M., ZHANG, X, Y., XIANG, Z, A, I., FENG, L, C., YANG, G, W., YU, M, D., ZHANG, X, Y. AND XIANG, Z, H., (1997). Study of relationships among species in Morus L. using randomly amplified Polymorphic DNA (RAPD). Scientia Agricultura Sinica., 30(1): 52-56.
GALDARISI, U., CIPOLLARO, M., BERNARDO, G. D., MASI, L. D., GALANO, G, and CASCINO (1999). Identification of the Edible Fig ‘Bianco del Cilento’ by RAPD analysis.
GALLEGO, F. J., and MARTINEZ, I (1996). Molecular typing of rose cultivars using RAPDs. Journal of Horticultural Sciences. 71(6):904-908.
GAN, Y, Y., ZAINI, S. AND IDRIS, A., (1981). Genetic variation in the grafted vegetatively propagated mango (Mangifera indica L.). Pertanika, 4: 53-62.
GRAHAM, J. AND Mc NICOL, R, J., 1995. An examination of the ability of RAPD markers to determine the relationships within and between Rubus species. Theor. Appl. Genet., 90(7-8): 1128-1132.
GRAHAM, J., Mc NICOL, R, J. AND Mc NICOL, J, W., (1996). A comparison of methods for the estimation of Genetic Diversity in strawberry cultivars. Theor. Appl. Genet.., 93(3): 402-406.
GUTMAN, F., BAR-ZVI, D., NERD, A., AND MIZRAHI, Y (2001). Molecular typing of Cereus peruvianus clones and their genetic relationships with other Cereus species evaluated by RAPD analysis. Journal of Horticultural Science and Biotechnology. 76(6): 709-713.
HADRYS, H., BALICK, M., SCHIERWATER, B. (1992) Applications of random amplified polymorphic DNA (RAPD) in molecular ecology. Molecular Ecology 1: 55-63
HALLDEN, C., NILSSON, N. O., RADING, I. M., SALE, T (1994). Evaluation of RFLP and RAPD markers in a comparison of Brassica napus breeding lines. Theor. Appl. Genet. 88: 123-128.
HASHIZUME, T., SATO, T. AND HIRAI, M., 1993. Determination of genetic purity of hybrid seed in watermelon (Citrullus lanatus) and tomato (Lycopersicon esculentum) using Randomly amplified Polymorphic DNA (RAPD). Japanese Journal of Breeding, 42(3): 367-375.
HEMANT KUMAR, N. V., NARAYANASWAMY, P., THEERTA PRASAD, D., MUKUNDA, G. K., AND SONDUR, S. N (2001). Estimation of genetic diversity of commercial mango (Mangifera indica L.) cultivars using RAPD markers. Journal of Horticultural Science and Biotechnology. 76(5): 529-533.
IQBAL, M. J., and RAYBURN, A.L (1994).Stability of RAPD markers for determining cultivars specific DNA profiles in rye (Secale cereale L). Euphytica 75:215-220.
JEON, H, J., BEEN, C, G., HONG, K, H., OM, Y, H. AND KIM, B, D., (1994). Identification of Cucurbitaceae cultivars using RAPD markers. J. Korean Soc. Hort. Sci., 35(5): 449-456.
KAFKAS, S., CERINER, S., PERL-TREVES, R (2001). Development of sex-associated RAPD markers in wild Pistacia species. Journal of Horticultural Science and Biotechnology. 76(2): 242-246.
KANG,B., KIM,K.,KIM,D., OH,D.,KANG,B,C., KIM,K,T,.KIM,D,S. AND OH,D,G., (1997). Randomly amplified Polymorphic DNA analysis of Capsicum germplasm. J. Korean Soc. Hort. Sci., 38(1): 39-42.
KARIHALOO, J, L., BRAUNER, S. AND GOTTLIEB, L, D., (1995). Randomly amplified Polymorphic DNA variation I the Egg plant, Solanum melongena L. (Solanaceae). Theor. Appl. Genet.., 90(6): 767-770.
KARP, A., SEBERG, O., BUIATTI, M. (1996) Molecular techniques in the assessment of botanical diversity. Annals of botany 78:143-149
KATZIR, PORTNOY. V., TZURI, G., CASTEJON-MUNOZ, M (1996). Use of random amplified polymorphic DNA (RAPD) markers in the study of the parasitic weed Orobanche. Theor. Appl. Genet., 93:367-372.
KHANDKA, D, K., NEJIDAT, A. AND GOLAN, G, A., (1996).Polymorphism and DNA markers for asparagus cultivars identified by random amplified polymorphic DNA. Euphytica, 87(1): 39-44.
KOLLER, B., LEHMANN, A., Mc DERMOTT, J, M. AND GESSLER, C., (1993). Identification of apple cultivars using RAPD markers. Theor. Appl. Genet.., 85(6-7): 901-904.
LAKSHMINARAYANA, S., (1980). Tropical and subtropical Fruits; composition, properties and uses. In: Mango. (Eds. Nagy, S and Shaw, P.E.) AVI publishing, Westport, Connecticut, pp: 184-257.
LANHAM, P, G. AND BRENNAN, R, M., (1999). Genetic characterization of gooseberry (Ribes grossularia sub-genus grossularia) germplasms using RAPD, ISSR and AFLP markers. J. Hort. Sci. Biotechnology, 74(3): 361-366.
LANNER, H, C., BRYNGELSSON, T. and GUSTAFSSON, M (1996a). Genetic validity of RAPD markers at the intra- and inter-specific level in wild Brassica spp. with n=9. Theor. Appl. Genet., 93(1-2): 9-14.
LANNER, H, C., BRYNGELSSON, T. and GUSTAFSSON, M (1996b). Diversity I natural populations of wild Brassica oleraceae as estimated by isozyme and RAPD analysis.Genetic Resources and Crop Evolution,43(1): 13-23.
LAS, H, V, F, J., JIMENEZ, J, M, C., VICO, F, R. AND LAS, H, V, F, J., (1996). RAPD fingerprinting in pepper (Capsicum annum L.) breeding lines. Capsicum and Eggplant Newsletter, 15: 37-40.
LEE, M, L., RYU, Y, J., CHUNG, T, Y. AND PARK, Y, H., (1993). Identification of Citrus spp. in Cheju using isozyme, RFLP and RAPD markers. RDA J. Agri. Sci. Biotec., 35(2): 193-197.
LEE, S, J., SHIN, J, S., PARK, K, W. AND HONG, Y, P., (1996). Detection of genetic diversity using RAPD-PCR and sugar analysis in watermelon (Citrullus lanantus (Thunb.) Mansf.) germplasm. Theor. Appl. Genet., 92(6): 719-725.
LEVI, A. AND ROWLAND, L, J., (1997). Identifying blueberry cultivars and evaluating their genetic relationships using randomly amplified polymorphic DNA (RAPD) and simple sequence repeat-(SSR-) anchored primer. J. Amer. Soc. Hort. Sci., 122(1): 74-78.
LEWIS, E., (1992). Identification of avocado cultivars with RAPD markers. Inligtingsbulletin- Instituut- vir- Tropiese- en- Subtropiese-Gewasse.241:7-9.
LOWE, A, J., GILLIES, A, C, M., WILSON, J., DAWSON, I, K. (2000). Conservation genetics of bush mango from central/west Africa: implications from RAPD analysis. Molecular Ecology. 9: 831-841
MAASS, H, I. AND KLAAS, M., (1995). Intraspecific differentiation of garlic (Allium sativum L.) by isozyme and RAPD markers. Theor. Appl. Genet., 91(1): 89-97.
MACHADO, M, A., COLETTA, F, H, D., TARGON, M, L, P, N. AND POMPEU, J, Jr., (1996). Genetic relationship of Mediterranean mandarins (Citrus deliciosa Tenore) using RAPD markers. Euphytica, 92(3): 321-326.
MEI LI and MIDMORE, D. J (1999). Estimation of genetic relationships of Chinese water chestnut (Eleocharis dulcis (Burm.F.) Hensch) cultivated in Australia, using RAPDs.,Journal of Horticultural Science and Biotechnology.74(2):224-231.
MEKURIA, G. T., COLLINS, G. G., SEDGLEY, M (1999). Genetic variability between different accessions of some common commercial olive cultivars. Journal of Horticultural Science and Biotechnology.74 (3):309-314.
MNENEY, E. E., MANTELL, S. H., BENNETT, M., KENT (2001). Use of RAPD markers to reveal genetic diversity and between populations of cashew (Anacardium occidentale L.). Journal of Horticultural Science and Biotechnology. 76(4):375-383.
MORI, M., HOSAKA, K., UMEMURA, Y. AND KANEDA, C., (1993). Rapid identification of Japanese potato cultivars by RAPDs. Japanese J. Genet. 68(3): 167-174.
MUKHERJEE, S, K. (1985). Systematic and Ecogeographic studies of crop Genepools: 1. Mangifera L. International Board for plant Genetic Resources, Rome, 92pp.
NEGI, S. S., Proceedings of sixth International Mango Symposium (2000). Acta. Hort. (Ed. Subhadrabandhu, S., Pichakum, A), 509: 69.
NOTH, M., FEINDT, F. AND MUHLBACH, H, P., (1996). Extraction of DNA and random amplified polymorphic DNA (RAPD) analysis of Ficus caracal. and Ficus sycomorus L. Mitteilungen-aus-dem-Institut-fur-Allgemeine-Botanik-Hamburg, 26: 153-160.
NOVY, R, G., KOBAK, C., GOFFREDA, J. AND VORSA, N., (1994). RAPDs identify varietal misclassification and regional divergence in cranberry (Vaccinium macrocarpon (Ait.) Pursh). Theor. Appl. Genet., 88(8): 1004-1010.
PARENT, J, G., FORTIN, M, G. AND PAGE, D., (1993). Identification of raspberry cultivars by random amplified polymorphic DNA (RAPD) analysis. Canadian J. Plant Sci., 73(4): 1115-1122.
POREBSKI, S., BAILEY, G. AND BAUM, B, R., (1997). Modification of a CTAB - DNA extraction protocol for plant containing high polysaccharide and polyphenol components. Plant Mol. Bio. Rep., 15(1): 8-15.
POREBSKI, S., BAILEY, G. AND BAUM, B.R (1997). Modification of a CTAB DNA extraction protocol for plants containing high polysaccharide and polyphenol components. Plant Molecular Biology Reporter. 15, 8-15.
PRAKASH, D. P., NARAYANSWAMI. P. AND SONDUR. S. N (2002). Analysis of molecular diversity in guava using RAPD markers. Journal of Horticultural Science and Biotechnology. 77(3): 287-293.
RAVISHANKAR, K.V, ANAND, L. AND DINESH, M.R (2000). Assessment of genetic relatedness among mango cultivars of India using RAPD markers. Journal of Horticultural Science and Biotechnology.75(2):198-201
REN, J, P., MCFERSON, J, R., LI, R, G., KRESOVICH, S. AND LAMBOY, W, F., (1995). Identities and relationships among Chinese vegetable brassicas as determined by random amplified polymorphic DNA markers. J. Amer. Soc. Hort. Sci.,120(3): 548-555.
ROJAS, R., CORONA, B. AND RIVAS, D., (1994). Random amplified polymorphic DNA (RAPD) markers and genetic polymorphism. Cultivos Tropicales, 15(1): 82-84.
ROM, M., BAR, M., ROMA, PILOWSKY, M. AND GIDONI, D., (1995). Purity control of F1- hybrid tomato cultivars by RAPD markers. Plant Breeding, 114(2): 188-190.
ROSSETTO, M., WEAVER, P.K., DIXON, K.W. (1995) Use of RAPD analysis in devising conservation strategies for the rare and endangered Grevillea scapigera (Proteaceae). (Molecular Ecology 4: 321-329
SAMEC, P. AND NASINEC, V., (1996). The use of technique for the identification and classification of Pisum sativum L. genotypes. Euphytica. 89(2): 229-234.
SANTOS, J, B, D., NIENHUIS, J., SKROCH, P., TIVANG, J., SLOCUM. M, K (1994). Comparison of RAPD and RFLP genetic markers in determining genetic similarity among Brassica oleraceae L. genotypes. Theor. Appl. Genet. 87(8): 909-915.
SCHNELL, R, J., RONNING, C, M. AND KNIGHT, R, J, Jr., (1995). Identification of cultivars and validation of Genetic relationships in Mangifera indica L. using RAPD markers. Theor. Appl. Genet., 90(2) 269-274.
SHU, C, J., SHOUCHUN, C., QINGMING, Y., CAO, J, S., CAO, S, C. AND YI, Q, M., (1995). RAPD analysis of genomic DNA in Chinese cabbage and other groups of Brassicas. Acta. Horticulturae Sinica., 22(1): 47-52.
SINGH, L, B., (1960). In: The Mango, Botany, cultivation and utilization. Leonard Hill, London.
STAUB, J, E., BOX, J., MEGLIC, V., HOREJSI, T, F. AND Mc CREIGHT, J, D., (1997). Comparison of isozyme and random amplified polymorphic DNA data for determining intraspecific variation in Cucumis. Genetic Resources and Crop Evolution, 44(3): 257-269.
TAI, T, H. AND TANKSLEY, S, D., (1990). A rapid and inexpensive method for isolation of total DNA from dehydrated plant tissue. Plant Mol. Bio. Rep., 8(4): 297-303.
TANAKA, J, I., AND YAMAGUCHI, S., (1996). Use of RAPD markers for the identification of parentage of tea cultivars. Bulletin of the National Research Institute of Vegetables, Ornamental plants and tea Series-B, 9; 31-36.
TANCRED, S, J., ZEPPA, A G. AND GRAHAM, G, C., (1994). The use of the PCR-RAPD technique in improving the plant variety rights description of a new Queensland apple (Malus domestica) cultivars. Australian J. Expt. Agri., 34(5): 665-667.
TENG, Y., TANEBE, K., ITAI, A (2001). Genetic relationships of pear cultivars in Xinjiang, China, as measured by RAPD markers. Journal of Horticultural Science and Biotechnology, 76(6): 771-779.
THIERRY, D, E, M, L., PANAUD, O., ROBERT, T., RICROCH, A. AND LE, T, D, E, M., (1997). Assessment of genetic relationships among sexual and asexual forms of Allium cepa using morphological traits and RAPD markers. Heredity, 78(4): 403-409.
TIVANG, J., SKROCH, P, W., NIENHUIS, J., VOS, N, D. AND DE, V, N., (1996). Randomly amplified polymorphic DNA (RAPD) variation among and within artichoke (Cynara scolymus L.) cultivars and breeding populations. J. Amer. Soc. Hort. Sci., 121(5): 783-788.
TRUKSA, M. AND PROCHAZKA, S., (1996). Potential use of RAPD markers in verification of cucumber hybrids. Rostlinna Vyroba., 42(6): 241-244.
WALKER, C. A. Jr., and WERNER, D. J (1997). Isozyme and RAPD analysis of Cherokee rose and its putative hybrids ‘Silver Moon’ and ‘Anemone’. Journal of American Society of Hort. Science. 122(5):659-664.
WARD, J.H. (1963). Hierarchic grouping to optimize function. Journal of the American Stastical Association. 58: 236-9.
WAYCOTT, W. AND FORT, S, B., (1994). Differentiation of nearly identical germplasm accessions by a combination of molecular and morphologic analyses. Genome. 37(4): 577-583.
WELSH,J. AND Mc CLELLAND,M.,(1990). Fingerprinting genomes using PCR with arbitrary primers. Nucleic Acids Res., 18: 7213-7218.
WIESMAN, Z., AVIDAN, N., LAVEE,S. AND QUEBEDKRISTIINA,A,K., (1998). Molecular characterization of common Olive varieties in Israel and the West bank using RAPD markers. J. Amer. Soc. Hort. Sci., 123(5): 837-841.
WILFINGER, W., (1999). Isolation of DNA from plant tissue containing polyphenolics and polysaccharides. MRC Technical Bulletin No. 7.
WILLIAMS, J, G, K., ARFALSKI, J, A. AND TINGEY, S, V., (1992). Genetic analysis using RAPD markers. Methods in Enzymology.
WILLIAMS, J, G, K., KUBELIK, A, R., LIVAK, K, J., RAFALSKI, J, A. AND TINGEY, S, V., (1990). DNA polymorphisms amplified by arbitrary primers are useful as genetic markers. Nucleic Acids Res., 18: 6531-6535.
YAE, B., KO, K., YAE, B, W. AND KO, K, C., (1995a). Classification of Malus domestica cultivars by random amplified polymorphic DNA markers. J. Korean Soc. Hort. Sci., 36(6): 824-828.
YANG, X., QUIROS, C, C, F. AND YANG, X, F., (1995). Characterizing the Celery genome with DNA –based genetic markers. J. Amer. Soc. Hort. Sci., 120(5): 747-751.
YOUNG, T, W. AND LEDIN, R, B., (1954). Mango breeding. Proceedings of the Florida State Horticultural Society, 67: 241-244.
YOUNG, T, W. AND LEDIN, R, B., 1954. Mango breeding . Proceedings of the Florida State Horticultural Society, 67: 241-244.
Appendix
APPENDIX
|
BUFFERS |
COMPOSITION |
CONCENTRATIONS
|
|
Extraction Buffer |
Tris base NaCl EDTA CTAB |
100 mM 1.4 M 20 mM 3 % |
|
Tris-EDTA (TE) Buffer |
Tris base EDTA |
10 mM 1 mM |
|
Running Buffer {Tris-Borate-EDTA (TBE)} |
Tris base Boric acid EDTA |
5x: 54 g/l 5x: 27.5 g/l 5x: 20 ml(0.5M, pH-8.0)/l |
|
Loading Buffer |
Bromophenol blue Sucrose in water |
0.25 % 40 % (w/v)
|

![]() THE
END
THE
END![]()