Analysis and Reporting

Business intelligence reporting and monitoring includes ad hoc and standardized
reports, dashboards, triggers and alerts. Business analytics include trend
analysis, predictive forecasting, pattern analysis, optimization, guided
decision-making and experiment design.

Dashboard Design: Key Performance
Indicators & Metrics
By Thomas Gonzalez
BrightPoint Consulting
Introduction
This article will focus on collecting and defining metrics and key performance
indicators for executive and operational dashboards. While the techniques
discussed here can be used across many different business intelligence
requirements gathering efforts, the focus will be collecting and organizing
business data into a format for effective dashboard design.
With the explosion of dashboard tools and technologies in the business
intelligence market, many people have different understandings of what a
dashboard, metric, and key performance indicator (KPI) consist of. In an effort
to create a common vocabulary for the scope of this article, we will define a
set of terms that will form the basis of our discussion. While the definitions
below might seem onerous and require a second pass to fully understand them,
once you have grasped the concepts you will have a powerful set of tools for
creating dashboards with effective and meaningful metrics and KPIs.
Metrics and Key Performance Indicators:
Metrics and KPIs are the building blocks of many dashboard visualizations; as
they are the most effective means of alerting users as to where they are in
relationship to their objectives. The definitions below form the basic building
blocks for dashboard information design and they build upon themselves so it is
important that you fully understand each definition and the concepts discussed
before moving on to the next definition.
-
- Metrics: When we use the term metric we are referring to a direct
numerical measure that represents a piece of business data in the
relationship of one or more dimensions. An example would be: “gross
sales by week.” In this case, the measure would be dollars (gross
sales) and the dimension would be time (week). For a given measure,
you may also want to see the values across different hierarchies within a
dimension. For instance, seeing gross sales by day, week, or month would
show you the measure dollars (gross sales) by different
hierarchies (day, week, and month) within the time dimension.
Making the association of a measure with a specific hierarchal level within
a dimension refers to the overall grain of the metric.
Looking at a
measure across more than one dimension such as gross sales by territory
and time is called multi-dimensional analysis. Most dashboards will only
leverage multi-dimensional analysis in a limited and static way versus some
of the more dynamic “slice-and-dice” tools that exist in the BI market. This
is important to note, because if in your requirements gathering process you
uncover a significant need for this type of analysis, you may consider
supplementing your dashboards with some type of multi-dimensional analysis
tool.
-
- Key Performance Indicators (KPI): A KPI is simply a metric that
is tied to a target. Most often a KPI represents how far a metric is above
or below a pre-determined target. KPI’s usually are shown as a ratio of
actual to target and are designed to instantly let a business user know if
they are on or off their plan without the end user having to consciously
focus on the metrics being represented. For instance, we might decide that
in order to hit our quarterly sales target we need to be selling $10,000 of
widgets per week. The metric would be widget sales per week; the
target would be $10,000. If we used a percentage gauge visualization to
represent this KPI and we had sold $8,000 in widgets by Wednesday, the user
would instantly see that they were at 80% of their goal. When selecting
targets for your KPI’s you need to remember that a target will have to exist
for every grain you want to view within a metric. Having a dashboard
that displays a KPI for gross sales by day, week, and month will require
that you have identified targets for each of these associated grains.
Scorecards, Dashboards, and Reports:
The difference between a scorecard, dashboard, and report can be one of fine
distinctions. Each of these tools can combine elements of the other, but at a
high level they all target distinct and separate levels of the business decision
making process.
-
- Scorecards: Starting at the highest, most strategic level of the
business decision making spectrum, we have scorecards. Scorecards are
primarily used to help align operational execution with business strategy.
The goal of a scorecard is to keep the business focused on a common
strategic plan by monitoring real world execution and mapping the results of
that execution back to a specific strategy. The primary measurement used in
a scorecard is the key performance indicator. These key performance
indicators are often a composite of several metrics or other KPIs that
measure the organizations ability to execute a strategic objective. An
example of a scorecard KPI would be an indicator named “Profitable Sales
Growth” that combines several weighted measures such as: new customer
acquisition, sales volume, and gross profitability into one final score.
- Dashboards: A dashboard falls one level down in the business
decision making process from a scorecard; as it is less focused on a
strategic objective and more tied to specific operational goals. An
operational goal may directly contribute to one or more higher level
strategic objectives. Within a dashboard, execution of the operational goal
itself becomes the focus, not the higher level strategy. The purpose of a
dashboard is to provide the user with actionable business information in a
format that is both intuitive and insightful. Dashboards leverage
operational data primarily in the form of metrics and KPIs.
- Reports: Probably the most prevalent BI tool seen in business
today is the traditional report. Reports can be very simple and static in
nature, such as a list of sales transaction for a given time period, to more
sophisticated cross-tab reports with nested grouping, rolling summaries, and
dynamic drill-through or linking. Reports are best used when the user needs
to look at raw data in an easy to read format. When combined with scorecards
and dashboards, reports offer a tremendous way to allow users to analyze the
specific data underlying their metrics and key performance indicators.
Gathering KPI and Metric Requirements for a Dashboard:
Traditional BI projects will often use a bottom-up approach in determining
requirements, where the focus is on the domain of data and the relationships
that exist within that data. When collecting metrics and KPIs for your dashboard
project you will want to take a top-down approach. A topdown approach starts
with the business decisions that need to be made first and then works its way
down into the data needed to support those decisions. In order to take a top
down approach you MUST involve the actual business users who will be utilizing
these dashboards, as these are the only people who can determine the relevancy
of specific business data to their decision making process.
When interviewing business users or stakeholders, the goal is to uncover the
metrics and KPI’s that lead the user to a specific decision or action. Sometimes
users will have a very detailed understanding of what data is important to them,
and sometimes they will only have a high level set of goals. By following the
practices outlined below, you will be able to distill the information provided
to you by the user into a specific set of KPIs and metrics for your dashboards.
Interviewing Business Users:
In our experience working directly with clients and gathering requirements for
executive and operational dashboard projects in a variety of industries, we have
found that the interview process revolves around two simple questions: “What
business questions do you need answers to, and once you have those answers what
action would you take or what decision would you make?”
-
- Question 1: “What business questions do you need answers to?”
The purpose here is to help the business user define their requirements in a
way that allows us to get to the data behind their question. For instance, a
VP of sales might have the question: “Which sales people are my top
producers?” or “Are we on target for the month?” In the case of the question
“Which sales people are my top producers?” we might then follow up with a
couple of questions for the VP and ask her “Would this measure be based on
gross sales? Would you like to see this daily, weekly, or monthly?”We
want to identify the specific data components that will make up the KPI or
metric. So we need to spend enough time with the user discussing the
question until we clearly understand the measure, dimension,
grain, and target (in the case of a KPI) that will be
represented.
-
- Question 2: “Based on the answer to Question 1, what other questions
would this raise or what action would you take?”
Once we understand the metric or KPI that is needed to answer the user’s
question, we then need to find out if the user would want to perform further
analysis based on that answer, or if they would be able to take an action or
make a decision. The goal is to have the user keep breaking down the
question until they have enough information to take action or make a
decision. This process of drilling deeper into the question can be analogous
to peeling back the layers of an onion; we want to keep going deeper until
we have gotten to the core, which in this case is the user’s ability to make
a decision or take action.
As a result of this iterative 2 part question process we are going to quickly
filter out the metrics and KPIs that could be considered just interesting from
the ones that are truly critical to the user’s decision making process.
Putting It All Together –The KPI Wheel
In order to help with this requirements interview process, BrightPoint
Consulting has created a tool called the KPI Wheel. The interview process is
very rarely a structured linear conversation, and more often is an organic
free-flowing exchange of ideas and questions. The KPI Wheel allows us to have a
naturally flowing conversation with the end-user while at the same time keeping
us focused on the goal of gathering specific requirements.
The KPI Wheel is tool that can be used to collect all the specific
information that will go into defining and visualizing a metric or KPI. We will
use this tool to collect the following information:
- The business question that we are trying to help the user answer.
- Which business users this question would apply to.
- Why the question is important.
- Where data resides to answer this question.
- What further questions this metric or KPI could raise.
- What actions or decisions could be taken with this information.
- The specific measure, dimension, grain and target of the metric or KPI.

Figure 1. KPI Wheel (A full size wheel is available for printing at end of
document.)
Start Anywhere, But Go Everywhere.
The KPI Wheel is designed as a circle because it embodies the concept that you
can start anywhere but go everywhere, thus covering all relevant areas. In the
course of an interview session you will want to refer to the wheel to make sure
you are filling in each area, as they are discussed. As your conversation flows
you can simply jot down notes in the appropriate section, and you can make sure
to follow up with more questions if some areas remain unfilled. The beauty
behind this approach is that a user can start out very high level “I want to see
how sales are doing” or at a very low level “I need to see product sales broken
down by region, time, and gross margins.”In either scenario, you able to start
at whatever point the user feels comfortable and then move around the wheel
filling in the needed details.
-
- Area 1: What Question?
This area of the wheel refers to the basic “What business question do you
need an answer to?” We can often start the interview with this question, or
we can circle back to it when the user starts off with a specific metric in
mind by asking them “What business question would that metric answer for
you?” This segment of the wheel drives the overall context and relevance of
the whole metric or KPI.
- Area 2: Who’s Asking?
For a given metric we want to know who will be using this information to
make decisions and take action. It is important to understand the various
users within the organization that may be viewing this metric. We can either
take note of specific individuals or just refer to a general group of people
who would all have similar business needs.
- Area 3: Why is it Important?
Because a truly effective dashboard can become a tool that is used every day
we want to validate the importance of each metric and KPI that is displayed.
Often times in going through this requirements gathering process we will
collect a long list of potential metrics and KPIs, and at some point the
user will have to make a choice about what data is truly the most important
for them to see on a regular basis. We suggest using a 1-10 scale in
conjunction with a description of why the metric is important so when you
begin your dashboard prototyping you will have context as to the importance
of this metric.
- Area 4: Data Sources
For a given metric or KPI we also want to identify where the supporting data
will come from. Sometimes in order to calculate a metric along one or more
dimensions we need to aggregate data from several different sources. In the
case of the metric “Top Selling products by gross margins” we may need to
pull data from both a CRM system and an ERP system. At this stage it is good
enough to simply indicate the business system that holds the data; it is
unnecessary to dive into actual table/field name descriptions at this point.
- Lower Half: Measures, Dimensions, and Targets
We want to make sure that we have captured the three main attributes that
create a metric or KPI, and have the user validate the grains of any given
dimensions. If we are unable to pin down the measure and dimension for a
metric, and/or the target for a KPI then we will be unable to collect and
visualize that data when it comes time to designing our dashboard.
- Lower Half: Questions Raised
In this section of the KPI wheel we want to list any other questions that
may be raised when we have answered our primary question. This list can
serve as the basis for the creation of subsequent KPI Wheels that are used
for definition of further metrics and KPIs.
- Lower Half: Actions to be Taken
For any given metric or KPI we want to understand what types of decisions
can be made or what types of actions will be take depending on the state of
the measurement. By filling out this section we are also able to help
validate the importance of the metric and separate the “must-have” KPI from
the “nice-to-have” KPI.
Wheels Generate Other Wheels
In filling out a KPI Wheel the process will often generate the need for several
more KPI’s and metrics. This is one of the purposes of doing an initial analysis
in the first place; to bring all of the user’s needs up to the surface. As you
work through this requirements gathering effort you will find that there is no
right path to getting your answers, questions will raise other questions, and
you will end up circling back and covering ground already discussed in a new
light. It is important to be patient, and keep an open mind as this is a process
of discovery. The goal is to have a concrete understanding of how you can
empower the user through the use of good metrics and KPIs.
As you start to collect a thick stack of KPI Wheels you will begin to see
relationships between the KPIs you have collected. When you feel that you have
reached a saturation point and neither you nor the user can think of any more
meaningful measurements, you will then want to review all the KPI Wheels in
context with each other. It is a good practice to aggregate the KPIs and create
logical groupings and hierarchies so you clearly understand the relationships
that exist between various metrics. Once these steps have been accomplished you
will have a solid foundation to start you dashboard visualization and design
process upon.
A Word About Gathering Requirements and Business Users
Spending the needed time with a formal requirements gathering process is often
something not well understood by business users, especially senior executives.
This process will sometimes be viewed as a lot of unnecessary busy work that
interrupts the user’s already hectic day. It is important to remember that the
decisions you are making now about what data is and is not relevant will have to
be done at some point, and the only one who can make this determination is the
user himself. The question is whether you spend the time to make those
fundamental decisions now, while you are simply moving around ideas, or later
after you have painstakingly designed the dashboards and built complex data
integration services around them.
As with all software development projects, the cost of change grows
exponentially as you move through each stage of the development cycle. A great
analogy is the one used for home construction. What is the cost to move a wall
when it is a line on a drawing, versus the cost to move it after you have hung a
picture on it?
Wrapping It All Up
While this article touches upon some of the fundamental building blocks that can
be used in gathering requirements for a dashboard project, it is by no means a
comprehensive methodology. Every business intelligence architect has a set of
best practices and design patterns they use when creating a new solution. It is
hoped that some of the processes mentioned here can be adapted and used to
supplement current best practices for a variety of solutions that leverage
dashboarding technologies.
Additional Information:
Mr. Gonzalez is the founder and Managing Director of BrightPoint Consulting,
Inc. BrightPoint Consulting, Inc is a next generation business intelligence
services firm that delivers corporate dashboard and advanced information
visualization solutions to organizations across the world. BrightPoint
Consulting leverages best of breed technologies in data visualization, business
intelligence and application integration to deliver powerful dashboard and
business performance solutions that allow executives and managers to monitor and
manage their business with precision and agility. For further company
information, visit BrightPoint’s Web site at
www.brightpointinc.com.
To contact Mr. Gonzalez, email him at
tgonzalez@brightpointinc.com.
Special Note:
If you found this article helpful and would like to apply these practices to
your dashboard requirements efforts, please visit us at
http://www.brightpointinc.com/KPIWheel.asp to use our online KPI Wheel. This
Rich Internet Application allows you to enter all of your KPI wheel information
via a graphical interface and provides additional functionality to either save
your work, or print it out in a report format. All information entered with this
tool never leaves your client machine and remains completely private.
The Path to Critical Thinking
By Stever Robbins
Harvard Business School Working Knowledge
Q. Can you write a refresher on critical thinking?
A. We business leaders so like to believe that we can think well, but
we don't. Only one in seven even reaches the top 10 percent of quality thinkers.1
The rest of us haven't even read a book on critical thinking, much less
practiced. We could fill a book on the topic, but instead, let's indulge in the
highlights of what makes for good critical thinking about decisions.
What's Logic Got To Do With It?
Nothing! We don't use logic to decide, or even to think. And a good thing, too,
or the advertising industry would be dead in the water. Unfortunately, all
of our decisions come from emotion. Emotional Intelligence guru Daniel Goleman
explains that our brain's decision-making center is directly connected to
emotions, then to logic. So, as any good salesman will tell you, we
decide with emotion and justify (read: fool ourselves) with logic.
Purely emotional decision making is bad news. When insecurity, ego, and panic
drive decisions, companies become toxic and may even die. Just look at all the
corporate meltdowns over the last five years to quickly understand where
emotional decision making can lead.
Critical thinking starts with logic. Logic is the unnatural act of knowing
which facts you're putting together to reach your conclusions, and how. We're
hard-wired to assume that if two things happen together, one causes the other.
This lets us leap quickly to very wrong conclusions. Early studies showed that
increasing light levels in factories increased productivity. Therefore, more
light means more productivity? Wrong! The workers knew a study was being done,
and they responded to any change by working harder, since they knew they
were being measured—the Hawthorne Effect.
We also sloppily reverse cause and effect. We notice all our high performers
have coffee at mid-morning, and conclude that coffee causes high performance.
Maybe. Maybe not. Maybe high performers work so late and are so sleep deprived
that they need coffee to wake up. Unless you want a hyper-wired workforce, it's
worth figuring out what really causes what.
There are many excellent books on logic. One of my favorites is the
most-excellent and most-expensive Minto Pyramid Principle by Barbara
Minto. It's about logic in writing, but you can use it for any decision you want
to think through in detail.
The Trap of Assuming
You can think critically without knowing where the facts stop and your own
neurotic assumptions begin. We aren't built to identify our own assumptions
without lots of practice, yet the wrong assumptions are fatal.
When we don't know something, we assume. That's a fancy way of saying, "we
make stuff up." And often, we don't realize we're doing it. When our best
performers leave, our first (and perhaps only) response is to offer them more
pay, without realizing that other motivations like job satisfaction or
recognition for accomplishments might be more important.
Finding and busting "conventional wisdom" can be the key to an empire. For
decades, the standard video rental store model assumed that people wanted
instant gratification and, to get it, they were willing to drive to a store, pay
a rental fee for a few days' access, and then drive back to the store in a few
days to return the movie. Thousands of big and small video rental parlors popped
up across the country using this model. But Reed Hastings challenged those
assumptions. He calculated that people would trade instant gratification for
delayed, and would pay a monthly fee if they could have movies mailed to them,
which they could keep as long as they liked. The result? Netflix. Estimated 2005
revenue: $700 million.
Assumptions can also cripple us. A CEO confided that he never hires someone
who backs into a parking space. His logic (and I use the term loosely): The
person will use time at the start of the day so they can leave more quickly at
the end of the day. He assumes face time equals results. In whose world? Many
people tell me they get more done in an hour at home than in eight hours in an
interruption-prone office. How many great employees will he miss because he's
not examining his assumptions?
Some assumptions run so deep they're hard to question. Many managers can't
imagine letting people work fewer hours for the same pay. "If they go home
earlier, we have to pay them less." Why? "Hours = productivity" is true of
assembly lines, but not knowledge work. Research shows that it's not how much
you work, but the quality of the work time that drives results.2 But
in most workplaces, hours count as much as results.
Next time you're grappling with a problem, spend time brainstorming your
assumptions. Get others involved—it's easier to uncover assumptions with an
outside perspective. Then question the heck out of each one. You may find that
one changed assumption is the difference between doing good and doing great.
The truth will set you free (statistics notwithstanding) Have you ever
noticed how terrified we are of the truth? We're desperately afraid that the
truth will reveal us as incompetent. Our situation really is hopeless. We really
aren't as great as we pretend. So we cling to our beliefs no matter how hard the
truth tries to break free.
Guess what, recording industry: Electronic downloads have changed the
nature of your business. Start asking how you'll add value in a world where
finding, packaging, and distributing sound is a commodity. Hey, ailing airlines:
Oil's expensive, customers won't pay much, and you have huge capital costs. That
hasn't stopped Southwest, Jet Blue, and others from making a fortune.
Nothing tells the truth like solid data and the guts to accept it. But it's
difficult in practice. When was the last time you identified and collected data
that contradicted your beliefs? If you found it, did you cheerfully change your
belief, or did you explain away the data in a way that let you keep your
comfortable pre-conceptions?
Here is a great exercise for your group or company. Have your general
managers list your industry's Unquestioned Truths, which they then must prove
with data. When a Fortune 500 CEO recently ran this exercise, Surprise! Some
"absolute truths" were absolutely false. Now he can do business his competitors
think is nuts. Analysts will say he's off his rocker, until his deeper knowledge
of truth starts making a small fortune.
One caveat: Be picky about where you get your data. The Internet can be
especially dangerous. The miracle of technology lets one bad piece of data
spread far and wide, and eventually be accepted as truth.
Help! I've Been Framed!
Not only may your data be disguised, but the whole problem itself may be
disguised! It seems obvious: we're losing money, we need to cut costs. Not so
fast! How you "frame" a situation—your explanation—has great power. Remember
assumptions? Frames are big ol' collections of assumptions that you adopt lock,
stock, and barrel. They become the map you use to explore a situation.
You're negotiating an acquisition. You're chomping at the bit. It's WAR!!
Competition is all. The frame is combat!
Or, you're negotiating an acquisition. You're on a journey with the other
party to find and split the value buried at the X. You still track your gains
and gather intelligence, but the emphasis is on mutual outcomes, not "winning."
In a zero-sum one-time negotiation, a combat frame may be the best tool. But
in a negotiation where you're free to develop creative solutions that can
involve outside factors, the journey frame could work best. "Instead of $100K,
why don't you pay $75K and let us share your booth at Comdex?"
Frames have great power! Presented with a potential solution to a problem and
told, "This course of action has a 20 percent failure rate," few managers would
approve. When that same solution is presented as having an 80 percent success
rate, the same manager is going to consider it more deeply—even though a 20
percent failure rate means the same thing as an 80 percent success rate! The
frame changes the decision.
Are you brave in the face of failure? Most people aren't. I recommend the
responsibility frame: "What aren't we doing what we should?" The responsibility
frame sends you searching for the elements of success.
The beauty is that no one frame is right, just different. The danger is when
we adopt a frame without questioning it. You'll do best by trying several
different frames for a situation and exploring each to extract the gems.
People Are Our Greatest Asset. Really
Critical thinking isn't just about what happens in our own brains. When you're
thinking critically in business, bring in other people! We don't consider the
people impact in our decisions often enough. In fact, we pooh-pooh the "soft
stuff." We feel safe with factors we can calculate on our HP-12B. But in truth,
business is about people. Multibillion-dollar mergers fail due to culture clash.
Customers, suppliers, partners, employees. They're as much a part of
your business as that sparkly new PC you use to play Solitaire. How will your
decisions change their lives? Imagine being them and let your imagination change
your decisions.
The Gallup organization estimates that 70 percent of America's workers are
disengaged, and disengaged workers are dramatically less productive, creative,
and committed than engaged workers. Yet few strategy meetings ask, "How can we
engage our employees more?" It's as if we say people are our greatest asset—but
we don't really believe it. If you want to improve your critical thinking, get
other points of view.
A Stitch in Time Saves Nine
Of course you know you should think about the consequences of your actions. But
with information overload, quarterly earnings pressure, sixty-hour weeks…who has
the time? We don't think much beyond the end of our nose.
But technology leverages the effects of our decisions throughout the
organization and even across the globe. So good thinking demands that you
consider consequences over many timeframes. Think out a month, a year, a decade,
many decades. That tanning booth looks great when you consider how you'll look
in a week, but is it worth looking like a leather overcoat ten years from now?
Long-term junkies like me are great at creating ten-year plans, but managing
next month's cash flow? Not likely. Short-term junkies are more common; they're
the ones who discount to make this quarter's numbers, while tanking the company
in the process. You can do better by considering multiple timeframes.
I could go on, but there's plenty here to chew on. Think about a decision
you're making, and pull in the rigor:
- Make sure you understand the logic behind your decision.
- Identify your assumptions and double-check them.
- Collect the data that will support or disprove your assumptions.
- Deliberately consider the situation from multiple frames.
- Remember the people!
- Think short and long term.
Good luck.
Additional Information:
1 Yes, I know. I’m making a point. Congratulations; you got it.
Color me subtle. Now go back and keep reading...
2The Power of Full Engagement, by Tony Schwartz and Jim Loehr,
New York: Simon & Schuster, 2003.
© 2005 by Stever Robbins. All rights reserved in all media.
Stever Robbins is founder and president of LeadershipDecisionworks, a
consulting firm that helps companies develop leadership and organizational
strategies to sustain growth and productivity over time. You can find more of
his articles at
http://LeadershipDecisionworks.com. He is the author of It Takes a Lot
More than Attitude to Lead a Stellar Organization
The Smart Business
Intelligence Framework
By Colin White
B-EYE Network
The Smart BI Framework brings together the four forces that drive business
operations: people, plans, processes and performance.
I’ve often made the point in my articles that business intelligence is no
longer just nice to have, but is essential to business success. I’ve also
commented at the same time that business intelligence applications and their
underlying data warehouses can only support the needs of the business if they
are tightly integrated into the overall IT environment. To highlight the
importance of business intelligence and the need to integrate it into the
enterprise, I developed the concept of the Smart BI Framework. The latest
version of this framework is shown in Figure 1.
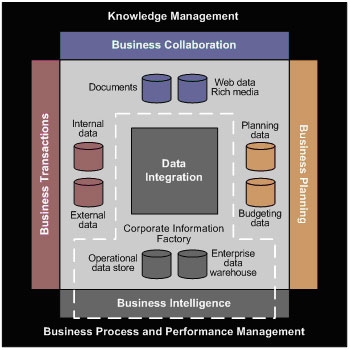
Figure 1. The Smart BI Framework
Copyright BI Research and Intelligent Solutions, 2005.
The Smart BI Framework brings together the four forces that drive business
operations and the IT systems that support them. These four forces are people,
plans, processes and performance.
A company’s people are the underlying foundation on which the business is
built. Without good employees a company will fail. How people perform their role
in the organization is changing. The speed of business today means that people
can no longer sit in ivory towers, or control and restrict the flow of
information within the organization. If information is power then it must be
made available to the people that need it for their jobs.
Key to collaboration and the sharing of information is knowledge management
(KM), which brings together portals, content management and collaboration tools.
The growing importance of business intelligence also means that it too must be
integrated into the KM environment.
As senior executives define business plans and goals they must communicate
them down through the corporate hierarchy. Targets must be developed and
measured, and employees must be told what is expected of them. Employee
compensation should generally be tied to achieving expected targets. Planning,
budgeting and forecasting systems form the basis of the planning process, but
collaboration capabilities are required for communicating plans and goals, and
business intelligence is essential for monitoring and managing targets.
Methodologies like balanced scorecards are also valuable for formalizing the
planning process and managing targets.
Once business plans and initiatives are agreed on, they are implemented in
business processes. Business process management is a growing technology for
modeling, simulating, deploying, integrating and monitoring business processes.
At present, process management is used primarily with operational business
transaction applications, but the need to manage document and information
workflows is bringing process management concepts and technologies into the
collaborative application environment.
Business transaction applications run business operations and associated
business processes and underlying activities. The role of business intelligence
applications is to monitor, analyze and report on those operations. The output
from business intelligence applications is used to determine how well actual
business operations are doing, compared against business goals and targets. If
these business goals and targets are not being achieved, then either business
plans or business operations must be adjusted accordingly. This aspect of
business intelligence is often called business performance management, which is
easily confused with business process management, especially given that process
management also supports the monitoring of business performance.
Business performance management is a term that is becoming increasingly
abused by vendors. Vendors will use the term to describe a product even if it
simply creates a business dashboard showing basic performance measures that are
unrelated to business plans, goals or targets. A true business performance
management application is closely tied to business plans and planning systems so
that performance measures can be related to business goals and targets.
Most business performance management applications deliver information that is
reactive in nature, i.e., the information produced identifies business problems
after they have occurred. Ideally, business users would like to be able to
predict or anticipate business issues before they occur. The integration of
business intelligence predictive technologies and planning methodologies into
the business performance management environment helps satisfy this requirement.
At present, business intelligence is data-centric, but as it becomes more
integrated with business operations it will need to become more process-centric
so that business intelligence results can be more easily related to business
processes and their associated business activities. This involves integrating
performance management and process management technologies. Perhaps the term to
use here is business process and performance management, or BPPM. This term
would at least remove the current industry confusion over the BPM acronym!
BPPM would allow business intelligence to be integrated into business
transaction processes and also allow business processes to be added to business
intelligence applications. An application example in this latter case would be
for a performance management application to alert a business user about a
business problem and provide a guided analysis workflow or procedure that helps
the user investigate the problem in more detail based on best practices.
At the heart of a business intelligence system are the operational data
store, enterprise data warehouse and data marts that supply the integrated,
clean and consistent data for analysis. Many traditional data warehouse
implementations have been deployed using the Corporate Information Factory
architecture developed by Claudia Imhoff of Intelligent Solutions. As business
intelligence becomes more integrated into the business environment, this
traditional architecture must evolve to support the technologies and techniques
outlined in this article. I have been working with Claudia to design an Extended
Corporate Information Factory that supports the Smart Business Framework
outlined in Figure 1. The Business Intelligence Network will publish an article
on the Extended Corporate Information Factory soon.
We can see then that a Smart BI Framework involves connecting together
business intelligence, business transaction and collaborative applications and
their underlying data and information stores. Further enhancing are integration
connections to business planning systems, and support for knowledge management,
business process and business performance management technologies. Such a
framework brings together the four main business drivers of an organization:
people, plans, processes and performance.
Additional Information:
Colin is the Founder of
BI Research. He is well known for his in-depth knowledge of leading-edge
business intelligence and business integration technologies, and how they can be
used to build a smart and agile business. With more than 35 years of IT
experience, he has consulted for dozens of companies throughout the world and is
a frequent speaker at leading IT events. He is also conference chair for DCI's
Portal, Collaboration and Content Management conference. Colin has written
numerous articles on business intelligence and enterprise business integration.
Colin has an expert channel and blog on the B-Eye-Network and can be reached at
cwhite@bi-research.com.
From Back Office to Boardroom:
Maximizing Business Intelligence Value with a BI Scorecard: Q&A
By Evan Levy and Bryan Rockoff
Baseline Consulting
In the BetterManagement.com video interview, From
Back Office to Boardroom: Maximizing Business Intelligence with a BI Scorecard,
featured speakers Evan Levy and Bryan Rockoff of Baseline Consulting
discussed the BI development lifecycle—from the initial business case through
desktop delivery and support—using real-life case studies to illustrate the best
practices, milestones and inherent risks in BI projects. Because the
audience had so many questions regarding business intelligence, our panelists
agreed to provide additional responses to several of the questions that could
not be addressed during the original interview.
How do you measure business or customer "usability"?
We like to identify "data usability" through the alignment of data access and
availability to supporting business actions. During the requirements,
specification, and design phases of BI and DW development, it's important to
identify some preliminary business actions that the business stakeholders would
like to address through the availability of detailed data. Once the new system
or application is released, it's important to stay in contact with the business
stakeholders to ensure that the detailed data is supporting business
decision-making and actions.
Do you focus on meeting the current business
needs, or thinking about what users could do if they had better access to BI?
You need to address both. However, focusing solely on
future needs isn't a recipe for success. You need to be able to support current
business needs that aren't a one-time only situation. We often recommend that
our clients evaluate the business stakeholder needs based upon their duration,
history, and longevity. If the problems have existed for a long-time (more than
6 months), this is certainly a candidate where detailed data can provide
assistance. If the problem is likely to exist beyond 6 months, this too should
be evaluated for support. We often encourage our clients to be carefully
consider addressing needs that are brand new that might exist for more than 90
days. The reason for this remark is simple - it might take longer to provide
data to respond to the problem than the actual longevity of the problem.
Ultimately, long term viability of a BI solution is dependent on the flexibility
and availability of data. So, you need to identify and respond to both long
term and short term needs.
How do you build a business case for increased system resources (due
to increased availability of info) when you can't "prove" it until the system is
in use?
This is a very good question, and a common one. Evaluating the benefits of a
solution can sometimes be difficult if the only means of measuring success is
usage and opinion. However, there is a practice that we recommend: identifying
business value metrics. It's actually simpler than you might realize.
The real challenge is identifying enough benefit needs and opportunities for
system growth until a critical mass is sufficient to sway IT (or business
management). There's no certainly formula or process, but we often recommend
that you communicate with potential business users and stakeholders on a monthly
basis to discuss new problems and opportunities. In the monthly discussions,
interview the stakeholders for the new problems and issues they're addressing -
and discuss some of their challenges: amount of pain, business benefit (time
saved, risk reduced, money made), visibility of problem to management,
longevity/history of problem, etc. It's valuable to keep a running list of the
opportunities. We categorize them by business area.
It's important to check back with the users on a monthly basis - and review
all needs with each participant. This will allow you to determine if there are
many (or any) common needs across business areas. You'll find that most
management will start paying attention when the list grows to 10-15 items and
there are several business users (or managers) that are prepared to go on record
with the specific needs.
What if there is no data, no history in a 30 years old company? All
info is in the "heads"of the old staff.
Unfortunately, we hear about this problem all too frequently. If the data
doesn't exist in electronic format, there's little opportunity to leverage
business intelligence or detailed data to support business processes and
decision-making. When we see this problem, there's only 1 solution: focus on
implementing operational systems to capture data to support future analysis.
Some users want us to create their reports like always. How do we
wean them from this? And others want every possible capability. How do we
control these folks?
Ensuring user self-sufficiency can be very challenging, particularly when the
users have become accustomed to a technical support staff that addresses
everything from query submission to data analysis. The real focus is to
identify the potential benefits to business users to become self-sufficient. We
often recommend that our clients take a hard look at the cost associated with
data analysis support (the people cost) vs. the business benefit associated with
the data analysis. This isn't a solution that can be developed overnight - it
might take a few weeks or months to assemble the details to determine if user
self-sufficiency is practical.
In the instances where it has made sense, the IT organizations had a very
limited staff and the cost associated with unanswered questions and delays made
it clear that the users needed to become self-sufficient.
Before you run off and start quantifying these values, be sure to determine
if the analysis is practical to deploy to end users' desktops. We have several
customers where making business users "self-sufficient" meant training them with
advanced statistical and numerical analysis tools. Clearly, not a practical or
appropriate solution. Hiring additional IT staff made sense.
Apparent contradiction: "Allow users to define success" versus "users
don't know what they need."
It's important to realize that users don't always know all the questions they
have about their data and their business. This is usually due to the fact that
they aren't aware of the information that is available - and they've often been
told that they can't get answers to their questions because of the lack of data
or information.
One simple tactic in helping the users define success is to have them focus
on the business actions they would like to analyze and affect. Identifying a
list of business actions quickly yields a list of business questions. When
we've identified business questions, we can identify the necessary data to
support analysis. Once you know the data and the business actions, tracking
usability becomes fairly clear. Did you provide the data and could the business
users make decisions based upon the data.
Can you have scorecards that are effective in smaller departments
within a large public company?
Yes, we have scorecards for departments as well as enterprise organizations.
The purpose of the scorecarding and assessment process is to compare your
activities against the best practices in place within other organizations. It's
important to compare/contrast your activities against a set of similar
organizations (in both size and complexity).
What does KPI stand for?
Key Performance Indicator.
What does SWOT stand for?
Strengths/Weaknesses Opportunities/Threats.
What tools are available to assist in developing objective scorecards
and create KPI's based on objective data analysis which would require
calculating a mean and measuring against that mean by calculating standard
deviations from that mean?
We use excel to address the calculation details that you're referring to. We
always suggest a system that encompasses whether best practices are used,
whether the job is getting done in a stream-lined and resource efficient manner,
Does the process ensure resusability and repeatability, and has the practice
built confidence with business users and IT stakeholders alike. We strongly
encourage a limited set of scores (e.g. 1 through 4).
Our clients to whom we provide HR services doesn't understand how HR
metrics could help. How can we bring value to our clients via install base
experience you might have in this area?
The world of HR services has a fairly well developed and accepted set of
KPIs. We don't specialize in HR-based KPI. We focus on developing BI systems
for companies to support their current KPI methods and practices through the
implementation of data automation and business intelligence.
Do you do any weighting of the business questions or even
sub-sections of the scorecard to ensure most important requirements are
addressed properly?
We actually prefer not to weight scorecard criteria. The focus of the
scorecard methodology is to compare/contrast the existence of methods and
practices to support business user needs, not the actual needs themselves. We
encourage IT to stay out of the judgement or valuation of projects and needs -
the actual business valuation of projects is something the business users should
own. We strongly suggest the IT team focus on working with the business users
to establish and facilitate a measurement system.
What does ETL stand for?
Extract, Transformation and Loading.
Do you need an specific IT solution to implement the scorecard?
No. Baseline's Scorecard focuses on 6 discrete methods and practices related
to BI and DW implementation and are technology agnostic. They include the areas
reviewed in the presentation. These areas are also applicable to other types of
functions and architecture environments (e.g. OLTP systems). The difference
would be in the specific best practices.
Should scorecards be tied/attached to bonus plans/employee annual
objectives, or should they be an independent source of scoring business results
for the company as a whole?
I'm not in favor of tying scorecard activities to compensation and bonuses.
The goal of a scorecard is to compare/contrast an organization's activities to
determine opportunities for improvement. Your question bring to mind the
benefits of a KPI system (key performance indicators) that is frequently used to
measure individual job performance. A KPI system is different from a
scorecard/assessment activity.
How effective has this approach worked in a public organization? How
difficult is it to eliminate political intrusion into the process?
We've been able to implement the scorecard approach in non-profit,
institutional, and government organizations. The goal is to compare/contrast
best practices from the industry. There's always an issue about the
applicability of industry best practices to a particular organization. We find
the value of the scorecard approach as a means to share alternative methods with
an organization open to change and improvement. The question that we often pose
to clients considering a scorecard implementation is determining if the
organization is open to change.
Who should conduct the audit?
We typically suggest a 3rd party conduct the audit. Someone with no vested
interest in the outcome.
How have others successfully kept business community/members from
glazing over when reviewing/discussing more technical sections of the BI
scorecard?
This is a very good question - no one wants to bore the business users or
waste their time. For the scorecard process to be effective, the interviews
must focus on the individual participant's responsibilities. The business users
shouldn't discuss technology - and the discussions should be well focused and
completed defined in advance to ensure the appropriate business users are
participating.
What can you do when you know a scorecard has been created to advance
a particular agenda?
Focus on the objective of the scorecard / assessment process. I strongly
encourage our clients insist that the assessment team be completely non-partisan
and unbiased. This often means ensuring that the company that conducts the
audit isn't a participant in any potential follow-on actvivities. The best
practices should reflect other, referenced organizations.
Additional Information:
Evan Levy is an industry recognized information technology expert, speaker,
and business consultant. As partner and cofounder of Baseline Consulting, he has
developed enterprise information systems at Boeing, Verizon, and Charles Schwab.
He has been published in a wide array of industry magazines, is a faculty member
of The Data Warehousing Institute, and a featured speaker at Marcus Evans, DCI,
the CRM Association, and DAMA International conferences and other industry
events.
Bryan Rockoff is an expert at enterprise data management. He is responsible
for bridging IT and end-user organizations at many of the industry-leading
retail, financial services, and entertainment companies so they effectively
utilize their enterprise data. His broad industry domain expertise and deep
technical experience in database architecture, ETL, data presentation and
enterprise architecture have helped companies address their brand management,
campaign management and closed loop marketing, category management, and
executive operational reporting challenges.
Barriers to Performance Improvement
By Becca Goren
SAS
Here's a wish-list that I suspect many of us share in
our work lives:
- If only we could measure an increase in mindshare.
- If only we measured what was really important.
- If only we could look at a customer's complete product portfolio and
service history.
- If only we knew which improvements would have the strongest effect on
revenue growth.
- If only management knew how little time we have to work on "priorities"
because we get bogged down answering emails and attending meetings.
So many "if only's." It's easy to feel helpless to make headway in your
performance management efforts. Where should you begin? Believe it or not,
although each industry/business model will present unique challenges, many
organizations have the same barriers to performance improvement. Some businesses
are much farther along than others in their performance management efforts, but
chances are good some "if only's" listed here resonate, as will some of the
barriers below.
Methodical Approach
Organizations begin performance management initiatives at any point - for
example, one may begin with defining the corporate strategy and determining KPIs
to support it. Others will initiate a business intelligence or data warehousing
project. For many executives, a scorecard without business intelligence behind
it is their first step. To achieve the best results, however, every phase –
reporting, management, and improvement should be done comprehensively. For
example, if a business is reporting on its global financials, but doesn't take
currency rate fluctuations into consideration, it is not seeing the whole
picture. If business units are not aligned around corporate goals, improvement
efforts (in the wrong direction) could be harmful. If analytics are applied to
improve performance by accurately forecasting demand, but the information isn't
shared with Sales, Marketing, and Customer Service as well as Supply – the
outcome could be devastating. Regardless of where you begin, here are some of
the gaps you might need to fill in.
The Barriers
Cultural
Businesses that have a culture of measurement find it easier to implement
performance management. However, even they have their struggles. The banking
industry, for example, has been at the forefront of performance management
initiatives but often product lines act independently so that seeing a full
customer view becomes very challenging. Often there is no one who "owns" that
full customer portfolio – so the customer strategy is fragmented. For other
businesses, the number one non-technology barrier may be lack of executive
buy-in.
Strategy, Execution, and the Elusive Enterprise View
If only the CEO had a full understanding of enterprise performance today and
built a strategy to reflect it. If only that strategy was shared uniformly with
all business units in a relevant, easy-to-understand method. The reality is that
individual departments often pilot a performance management initiative and the
expansion to the enterprise can be difficult. When performance management begins
without a full picture of the enterprise today, what are the ramifications? How
can you expand the view of your business today? How can you ensure the strategy
and its execution are holistic?

Alignment, Collaboration, and Accountability
Alignment is more than having buy-in to the organization's strategy (although
that's a good place to begin). Key Performance Indicators (KPIs) need to be
aligned or "mapped" to support the overall strategy – from the CEO to the
individual contributor. This alignment helps everyone to move together – in the
right direction. A step beyond alignment is collaboration – where business units
work together – sharing performance information and together making
improvements.
Lack of collaboration can be costly. In our banking example, a customer who
is deemed profitable by one product line may be on the unprofitable list for
another. Marketing campaigns that promote a product line without full support
from production, distribution, customer service and sales is bound to flounder.

Financial Transparency
Many businesses are struggling under the threat of public scandal and
incarceration to have financial transparency, let alone the ability to improve
the financial outlook. For some, Sarbanes Oxley or other compliance requirements
act as a catalyst for larger performance management initiatives. What are the
steps to financial transparency and how do business move beyond mandates to get
to improvements? Wouldn't you love to be able to reduce costs knowing it won't
negatively impact profitability?

All Kinds of Integration
For performance management to be effective – before major performance
improvements can take place, integration is key – all kinds of integration.
Alignment and collaboration bring an integration of goals and supporting
activities. But the integration of technology and methodologies are needed to
support performance management efforts. Perhaps there are many "performance
management initiatives" underway at your company, but nothing is tying them
together. For most businesses, integrating the information scattered throughout
the company is the biggest integration challenge – this is an initial step to an
enterprise view of performance.
Predictive Analysis and Advanced Analytics
Everyone is talking today about predictive analysis, and yes, predictive
analysis can point the way to the pot of gold – but you need a good road map to
go along with it. If the enterprise performance information is there and the
strategy is in place, analytics can make the difference between managing
performance and improving performance.
With these tools, you can discover why problems occurred and which decision
will best support the strategy. You can close the loop by verifying your
strategy's effectiveness. And ultimately get to the pot of gold – whether that
is a better ability to respond to market changes or making decisions that
provide competitive advantage.
If only you had that roadmap to the pot of gold. If only your entire
organization were aligned around common goals. If only you could execute on your
goals, confident with the knowledge that you are improving the performance of
your organization. If only you could eliminate your "if only’s" one by one.