Are All of Your Customers Profitable
(To You)?
By Gary Cokins
SAS
Executive Summary
Some customers purchase a mix of relatively low margin products. After adding
the "costs-to-serve" those customers apart from the products, these customers
may be unprofitable. For other customers who purchase a mix of relatively
high-margin product, they may demand so much in extra services that they too
could potentially be unprofitable. How does one properly measure customer
profitability?
If two customers purchased from your company the exact same mix of products and
services at the exact same prices during the exact same time period, would they
be equally profitable? Of course not. Some customers behave like saints and
others like sinners. Some customers place standard orders with no fuss, while
others demand non-standard everything. Some customers just buy your product or
service and you hardly ever hear from them, while others you always hear from
-and it is usually to change their delivery requirements, inquire about and
expedite their order, or to return or exchange their goods. In some cases, just
the geographic territory the customer resides in makes the difference.
Employees often wonder if the bothersome or remote customer is worth it? What
they are really asking is this. "If we added up all the costs of our time,
effort, interruptions and disruptions attributed to those kinds of customers, in
addition to the costs of the products and base service that that customer drew
on, did we make any profit?" That is a good question. How do we know? How do we
know the level of profitability of any or all of our customers? Most
organizations do not. Since organizations are continuously pursuing prospects,
they might want to know how profitable will they be relative to each other or to
our existing customers?
The Pursuit of Truth About Profits
Why would you want to know these answers? Possibly to answer more direct
questions about customers, such as:
- Do we push for volume or for margin with a specific customer?
- Are there ways to improve profitability by altering the way we package,
sell, deliver, or generally service a customer?
- Does the sales volume justify the discounts, rebates or promotion
structure we provide the customer?
- Can we realize our changing strategies by influencing our customers to
alter their behavior to buy differently (and more profitably) from us?
To be competitive, a company must know its sources of profit and understand its
cost structure.
A competitive company must also ultimately translate its strategies into
actions. For outright unprofitable customers, you would want to explore the
possible options of raising prices, or surcharging them for the extra work. You
may want to reduce the causes of your extra work for them, streamline your
delivery so it costs you less to serve them, or finally alter their behavior so
that those customers place less demands on your organization.
In Peter Francese's book, Marketing Know-How, he posed key questions
around a customer/ marketing model which basically instructs marketers to
"follow the money!" Francese starts by asking what kinds of customers are loyal
and profitable... and what kinds are only marginally profitable, or worse yet,
losing you money. The good news is there is now a cost measurement methodology,
called activity-based costing (ABC), which can economically and accurately trace
the consumption of your organization's resource costs to those types and kinds
and customer segments who place varying demands on you. Determining your
"costs-to-serve" customers is logical with ABC.
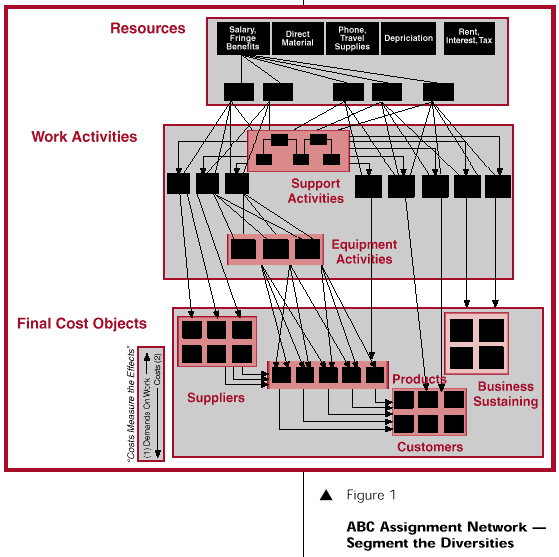
Figure 1 shows the framework for how ABC traces, segments and re-assigns costs
based on the cause-and-effect demands triggered by customers and their orders.
ABC refers to these triggers as "activity drivers." When the cost of processing
a customer's orders is subtracted from the sales for those orders, you can
really know historically whether you actually made or lost money, and
prospectively whether an accepted price quote will be profitable or not.
Employee Denial, Guilt And Resistance To Change
Here is an ironic question. Why would some people not want to have access to
customer profitability data? Some employees intuitively suspect the truth -that
there are losers -but these employees will likely presume that their companies
would never want to "drop" those customers; and besides that, they perceive that
those customers still provide sales volume that somehow "covers the overhead."
But maybe all the product costs, base service costs and unrecognized extra costs
alone are not fully recovered by the sales prices!
In other situations, some employees are evaluated or incented based on sales
volumes, so they don't place as much importance on costs and profits -just sales
volume. Some employees believe that on average there is very little that
distinguishes differences between customers, and they basically view customers
as clones for each other. Some employees may think that for those customers who
create more extra demands on work through their expedites, frequent small
orders, slow-bill collection follow-up, difficult or distant access, and the
like, those high-maintenance customers should be subsidized by the effort-free
customers. These employees are not disloyal; they need awareness of how profits
are generated and a change of their mind-set.
The issue here is not only determining the profit contribution of customers,
including "accurate" costs for the products they buy, but also understanding the
elements of customer-specific work that comprise the entire cost to serve each
of them. It is no longer acceptable to not have a rational system of assigning
so-called non-traceable costs to their sources of origin.
Beneath The Iceberg: Unrealized Profits
What is the reality of profits and losses? When companies take the time to
define and measure their in-house work activities and directly associate them to
the bigger and smaller consumers of their work, the obvious occurs. In addition
to the products and base-services provided to customers, there are big users,
small users and those in-between. But since pricing is usually determined (and
quoted) based on average-based standards, those customer-driven imbalances are
rarely reflected in the pricing.
When the inequities are replaced with true measures of the cost-to-serve
customers, the companies who have performed this analysis have realized that
they make a lot of profit on the winners and then give back quite a bunch on the
losers. And both the profits and losses are usually big numbers. The company
only banks the net difference. Although not empirically tested, experiences with
these measures show that the total amount of the profits, excluding any losses,
usually exceeds 200% of the resulting reported net profit -and greater than 10X
has even been measured!
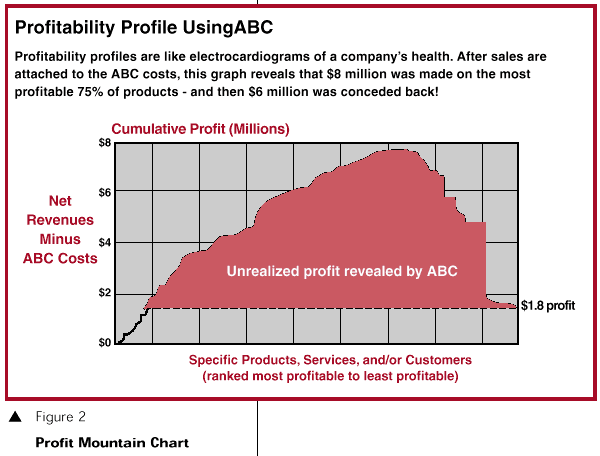
Figure 2 shows a graph of how unrealized profits can be hidden due to inadequate
costing. The graph is of each product's cost, net of sales, to reveal each
product's profit. The products are rank-sorted left-to-right by the most to the
least profit margin rate. The very last data-point equals the firm's total net
profit, as reported in their profit and loss statement. For this organization,
total revenues were $20 million with total costs $18 million to net at $2
million; but the graph reveals the mix of that $2 million.
How can this be happening? How can such unrealized profits be so offset by the
unprofitable products and customers? The major reason is no one sees it. Some
people intuitively think it but can't prove it. In many organizations, the cost
accounting system is referred to as "a bunch of lies that we all agree to."
The traditional financial reporting in no way reveals the separate profit and
losses for several reasons. (1) It examines and reports department level
expenses but not on the work-efforts within a department; and (2) the non-direct
product costs are allocated exclusively to products or base-services but rarely
isolated and directly charged to specific customer segments. In financial
accounting terms, the costs for selling, advertising, marketing, logistics,
warehousing and distribution are immediately charged to the "time period" in
which they occur. Consequently the accountants are not tasked to trace them to
customer segments. Today's selling, merchandising, and distribution costs are no
longer trivial costs they are sizable. As an example, it now costs more for
General Motors to sell its cars than to make its cars!
LSI Logic, a high-tech semiconductor manufacturer,
performed ABC and discovered they were making roughly 90% of their profits from
10% of their customers. That alone is not unusual, but they were losing money on
half of their customers. Upon discovering this, what LSI Logic did next was
explain to some of their unprofitable customers how those specific customers
could alter their own behavior to lessen the workload on LSI Logic so that a
fair profit could be attained. The remaining unprofitable customers were "fired"
-they were asked to take their business elsewhere as it was evident there was
little hope that their sales would cover their costs. LSI Logic's sales levels
then predictably dipped, but profits tripled. The lesson is there is a "quality
of profit" associated with sales volume and product mix; there should be a focus
on the customer contribution margin devoid of cost allocations similar to the
current focus of cost accounting on product profit margins.
Structural Deficiencies With Traditional Financial Accounting
The fact is that customers are the source of a much greater amount of
work-creation than most people imagine. For wholesalers and distributors, one
can argue that customers cause all of the work. And even once that is
understood, traditional accounting systems are ill equipped to trace the costs.
What is needed is to first accumulate the costs of the various support work
activities for the order-fulfillment work, and then to assign this
order-fulfillment work into the product and customers who cause work to happen
in varying amounts -and in proportion to their use. Traditional financial
accounting systems are structurally deficient to accomplish this.
Why? Traditional accounting only reports employee-related salary and fringe
benefit costs, which reveal no insights to the content of work performed, which
is controllable. Traditional accounting also groups costs according to the
hierarchical and vertical appearance of the organization chart, denying any view
of the true end-to-end business processes that start and finish with customers.
Business processes are unaware of artificial organizational boundaries. In
contrast, ABC flexibly defines and measures costs at the level of work
activities, regardless of function. ABC then allows re-assembly and linkage of
these same work activity costs to how each customer, channel and market segment
consumes the costs to get served.
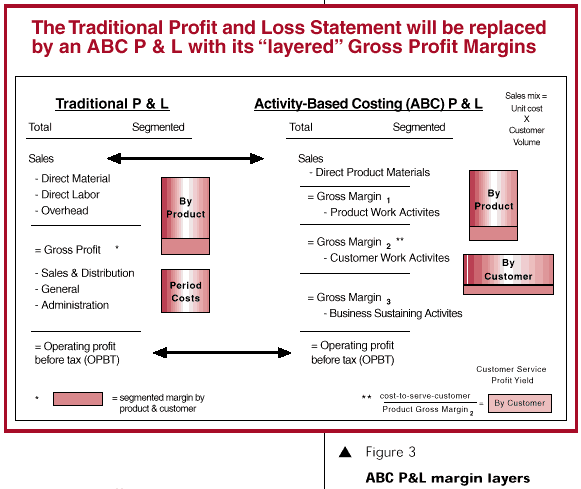
With activity-based costing, the traditional profit and loss statement (P&L)
changes and becomes more like the layers on an onionskin.
Figure 3 contrasts the traditional P& L with an ABC P& L. It shows a simple
report revealing varying margin layers. The left side of the figure shows what
most managers see today. Only the products are costed (and the product overhead
costs are frequently misallocated to them). The right side ABC P& L shows that
first, exclusively product-related margins can be viewed, and without the
misleading distortions from overhead cost misallocations (traditional overhead
cost allocations apply volume-based factors without correlation, and not
use-based activity drivers possessing cause-and-effect relationships). Then, as
customers consume (i. e. purchase) their unique quantities of the mix of
products, where some products may be stand-alone profitable and some not at the
product level, then the "cost-to-serve" customer-related costs are combined to
calculate the next margin layer.
ABC/M Contribution Layering
A true ABC/M system operates as a re-assignment system. Let's revisit Figure 1
reveals how the costs flow through the cost assignment network.
ABC is a Cost Re-Assignment Network
In complex, support-intensive organizations, there can be a substantial chain of
support activities prior to and upstream from the work activities that
eventually trace into the final cost objects. These chains result in
activity-to-activity assignments, and they rely on intermediate activity
drivers in the same way that final cost objects rely on activity drivers to
re-assign costs into them based on their diversity and variation.
The direct costing of indirect costs is no longer, as it was in the past, an
insurmountable problem given the entry of computerized ABC software that evolved
in the early 1990s. ABC allows for intermediate direct costing to a local
process output or to an internal customer or required component material that is
causing the demand for work. That is, ABC cost flow designs no longer have to
"hit the wall" from limited spreadsheet software and its restricted
columns-to-rows math. The new generation of ABC software is arterial in design.
Eventually via this cost assignment and tracing network, ABC re-assigns 100% of
the costs into the final products, service lines, customers and business
sustaining costs.
Let's review the cost assignment network in Figure
1 beginning where customers (or beneficiary receivers) initiate the demands on
work that ultimately requires resources to be consumed.
Starting at the bottom module, all organizations have customers that behave as
final-final cost objects; their existence ultimately creates the need for
a cost structure in the first place. For example, customers purchase varying
quantities or amounts of the organization's products or service lines. In some
unique cases, different suppliers create differing demands on work for
similar products, so the suppliers may also be segmented to reflect their
variation. Note that the supplier's total product or service line costs,
although they may be identically priced as those of an alternative supplier,
would now reflect different costs reflecting the varying ease or difficulty
working with that supplier.
It is in this final cost object module where diversity is most apparent and into
which all upstream activity costs flow.
Next, skipping past the middle module (i. e., activity costs) and moving up to
the top module, the traditional general ledger expense balances are displayed.
The cost assignment diagram in Figure 1 only reveals assignment paths from the
payroll-related costs; but paths for the non-payroll expenses, such as supplies
and operating expenses, also exist for any organization. These paths are simply
not shown to reduce the complexity of Figure 1, but all of the non-payroll
related resource costs also flow through the cost assignment network.
Payroll-related costs are very important to ABC because they are the more
controllable expenses. It is the activities performed by workers who use those
resource costs that "drag" along and consume many of the other non-payroll
resource costs such as supplies. (Figure 1 traces the ledger expense balances
into a "staging" account of work groups, which in turn are re-assigned to the
work activity costs using resource drivers, such as timesheets.)
The most important ABC module is arguably the middle one -the activity module.
This module is not only where the work activity costs are initially costed, but
where they are further re-assigned to the supplier, product, service line,
customer or business sustaining final cost objects that collectively
create demands on the organization's work. Unfortunately, for many
organizations, after they have expended the effort to define their work
activities and calculate their activity costs, they stop there. Activity costs
are the starting point of both ABC and ABM, not the end!
One of the insights gained from ABC/ M is an understanding of how final cost
objects, such as products and customers, vary with the work-related activities
that they consume. Some activities, such as opening a new customer's account or
placing a product into a box, vary directly with each specific customer or
product (i. e., cost object) processed or serviced. These are called
unit-level costs.
There are other activities, such as changing over machine settings in order to
make a different product, that vary independently of the batch-size (quantity of
the machine run volume). These kinds of work activities vary directly with each
event when the machine is re-set. Another example, customer-related, is where
the length of time processing a customer invoice is independent of the price of
the invoice. These are referred to as batch-level costs.
Both unit-level and batch-level costs can be attributed to specific products or
customers without debate since the products or customers are the final cost
objects causing and consuming the work. There is third higher level activity
cost type referred to as "sustaining" costs. Sustaining costs can be applied to
the business as a whole*, to customers, to products, and to suppliers.
Business Sustaining Costs
Business sustaining costs are those costs not caused by products or
customer service needs. The consumption of these costs can not be logically
traced to products or customers. One example is the accounting department
closing-the-books each month. How can one measure which product caused more or
less of that work? One can not.
Another example is lawn maintenance. Which customers or products cause the grass
to grow? These kinds of activity cost cannot be directly charged to a customer,
product or service in any possible fair and equitable way; there is simply no
"use-based " causality originating from the product or customer. The need to
recover these costs via pricing or funding is eventually required, but that is
not the issue here; the issue is fairly charging cost objects when no causal
relationship exists.
Business sustaining costs (or
organization sustaining for governments and not-for-profit organizations)
can eventually be "fully absorbed" into products or customers, but such a cost
allocation is blatantly arbitrary. There simply is no cause-and-effect
relationship between a business sustaining cost object and the other final cost
objects. When these costs are assigned into final cost objects, organizations
often refer to them as a "management tax" representing a cost of doing business
apart from the products and services.
Examples of final cost objects that comprise business sustaining cost objects
may include: senior management (at individual levels, such as corporate,
division and local) or government regulatory agencies (such as environmental,
occupational safety, or tax authorities). In effect, these organizations via
their policies and compliance requirements or via their informal desires such as
briefings or forecasts, place demands on work activities not caused by or
generally attributable to specific products or customers.
Other categories of expenses that may be included as business sustaining costs
may be idle capacity costs or research and development (R& D). R& D costs might
be optionally assigned so that the timing of the recognition of expenses is
reasonably matched with revenue recognition for sales of the products or service
lines. However, remember that ABC is managerial accounting, not regulated
financial reporting, so strict rules of generally accepted accounting principles
(GAAP) do not need to be followed, but they can be borrowed.
Figure 4 expands on the ABC/ M cost assignment network's final cost object
module. It displays two layers of "nested" consumption sequence of costs. A
metaphor for this consumption sequence is the predator food chain from the
animal kingdom. The final-final cost object, which in this figure is the
customer, ultimately consumes all of the costs, except for the business
sustaining costs.
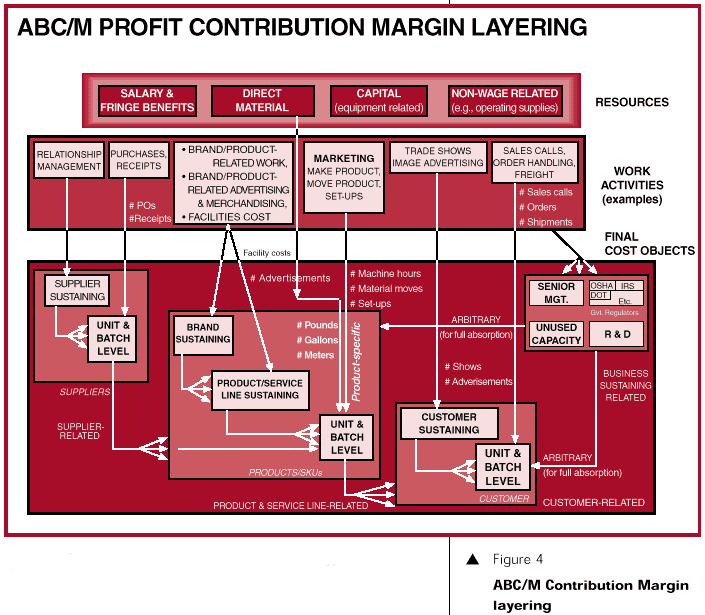
Within each of the major final cost object categories (suppliers, product/
service line, and customers), they each have their own "sustaining costs" which
are assignable to their end product or end customer. However when tracing these
"sustaining costs," they cannot apply a measurable quantity volume as applied by
the batch-level and unit-level activity costs. For example a branding program
may benefit a select group of products, for which those products can be
specified, but how much of the branding cost should be allocated to each
product? These "product sustaining costs" can be traced using some "shared"
basis, such as sales unit volume or spread evenly, even though there is no
cause-and-effect.
In short, sustaining costs can be assigned to products or customers using what
may appear as the old flaws of cost allocations. However this method of
capturing diversity of mix at least segments and isolate the sustaining costs to
the type of final cost objects that cause the activity costs to occur -and
usually to a sub-group within that final cost object.
Additional Final Cost Object Types
In effect, what ABC/ M does is reflect how the variation and diversity of cost
objects segment activity costs and resource costs. If there are substantial
costs and sufficient diversity in another type of cost object, for example the
type of customer order (standard, special, international, etc.), then the "order
type" can qualify as its own separate and visible final cost object. It would
serve as an intermediate repository to capture diversity of the type of work
output. After activity costs are traced to these final cost objects, then those
costs are re-traced to the customers based on the mix of order types consumed by
each customer. "All customers are not created equal."
Figure 5 displays three potential cost object types that could be isolated and
assigned as an intermediate destination for activity cost accumulation prior to
being re-assigned to customers.
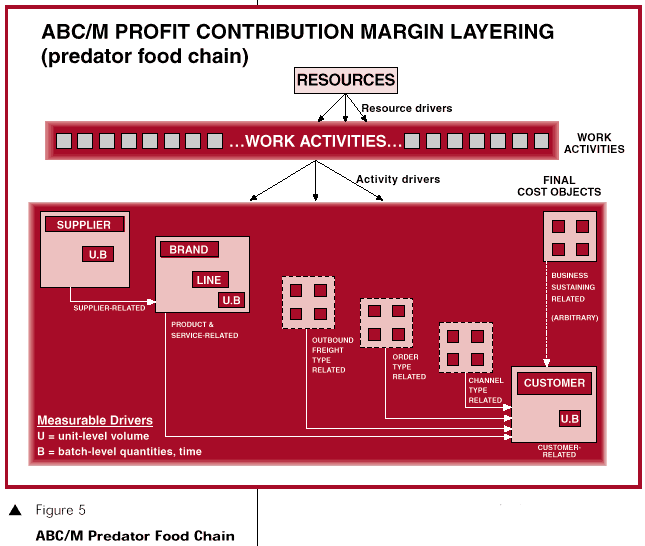
Note that without them being isolated, these activity costs would have been
directly assigned to customers from the same activity costs. But by isolating
them, via a two-step cost assignment method, the activity costs are grouped the
way they match the work, and then the customer is shown to be "purchasing" the
output. The second of the cost assignments are referred to as cost object
drivers (the term "activity driver" is no longer applicable as the work activity
already accumulated in the final cost object.)
Advanced ABC/ M users may wish to view product
profitability including customer costs (e. g., to print prices in their price
list catalog). Today's advanced ABC/ M software allows multidimensional
views of various combinations of cost objects. A two-way bi-directional linkage
replaces the sequence of the predator food chain. Other dimensions can include
geographical sales territories, store locations, or specific salespeople.
The ABC/M Customer Profit and Loss Statement
As costs flow from one final cost object to another final cost object, each flow
will consume the unique mix of the upstream cost object. That is, in simpler
terms, an individual customer's total costs (apart from its direct
cost-to-serve) are inclusive of only the product quantities and mix that it
purchased. And each product incurred its costs with a cause-and-effect
relationship, not with an arbitrary, indirect cost allocation.
Figure 6 reveals the "layering" of costs similar to Figure 3, but in the shape
of a 3-D cube. The costs for each successive step along the "predator food
chain" are inclusive of only the unique mix of costs that were purchased
or consumed. The "structural drivers" provide the assignment bridge into the
next successive level that consumes the upstream costs.
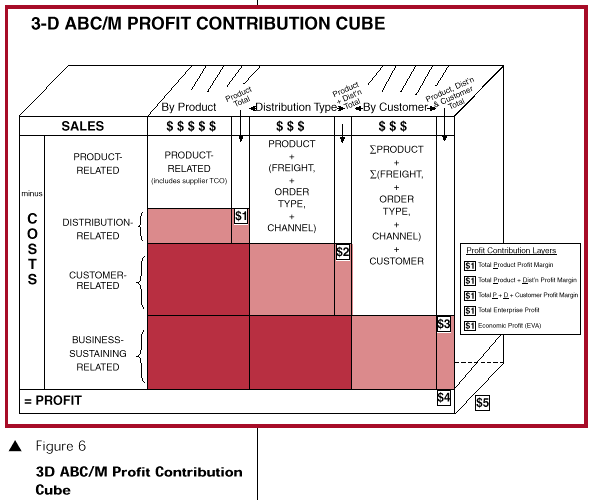
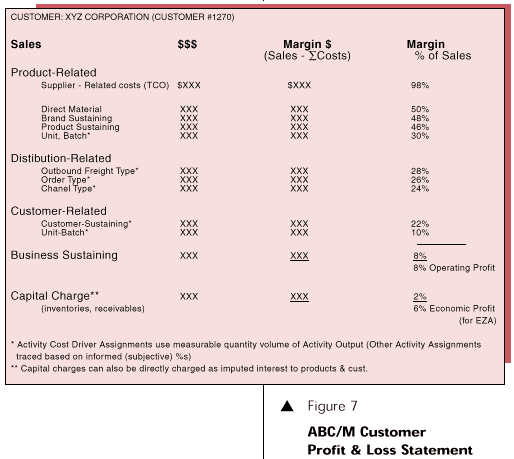
Figure 7 is an example of an individual customer profitability statement. There
can be a P& L statement for each customer as well as logical groupings of
customers. There can be a tremendous amount of detail that lies below each of
these reports. For example, the individual products and service lines purchased
can be examined as they are a mix of high and low margin on their own. And
within each product or service line, the user can further drill down to examine
the content and cost of the work activities and materials (" the bill of costs")
for each product and service line. This is powerful information. The sum of all
of the customer profit and loss statements for this type of report will sum to
the entire business' enterprise-wide profit (or loss).
Revelations From The New Cost Data
Note that in Figure 3 the three margin levels do not include any "business
sustaining expenses," the company internal tax, which were not caused by
products, base-services or customers. It is true that these expenses must some
way be recovered via pricing, but an ABC profit and loss statement reveals that
they do not necessarily have to be recovered by all products and by all
customers.
This revelation can give progressive and innovative companies tremendous
flexibility to: (1) price low for emerging products and for targeted new
customer prospects, and (2) price higher for more loyal and secure customers
less likely to switch to competitors. However, if too many prices are set
slightly above the "marginal costs," as time passes where products are
phased-out and customers depart, then the profit structure risks being slowly
replaced without enough sales to recover the business sustaining costs. So this
practice must be carefully managed. For example, low prices to capture new
customers will need to be gradually increased over time.
The ratios of the "cost-to-serve-customers" to the
product mix margin are revealing when compared on a customer-by-customer basis
(or by segment or channel). A traditional belief that large volume customers
produce proportionately large profits may be dispelled. Companies using ABC
often discover that if given an extra hundred dollars to "serve" a customer, it
would return a relatively higher profit contribution from mid-size or smaller
customers.
Migrating Customers to Higher Profitability
Figure 8 provides a two-axis view of customers with regards to (1) the
"composite margin" of what each purchases (reflecting net prices to them), and
(2) their "cost-to-serve." Each quadrant of the matrix shows a different type of
customer. Figure 8 debunks the myth that companies with the highest sales must
also generate the highest profits. This is not necessarily true!
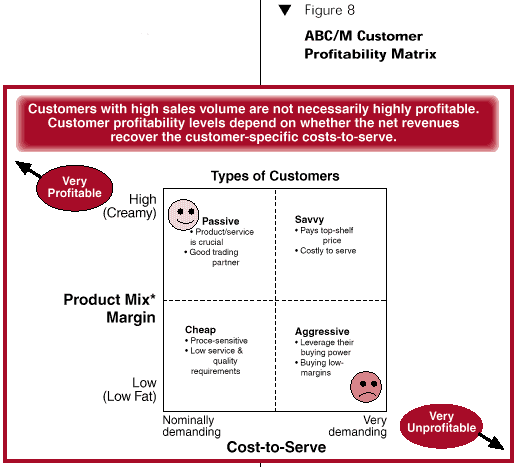
Figure 9 shows various customers as points of an intersection of Figure 8's
matrix. The objective is to make all customers more profitable -represented by
driving them to the upper-left corner. This can be accomplished by: (1) managing
their "cost-to-serve" to a lower level, (2) reducing their services, or (3)
raising prices or shifting the customers purchase mix toward richer,
higher-margin products and service lines. (Note that migrating customers to the
upper left corner is equivalent to moving individual data-points from right to
the left in Figure 2, the profitability profile.
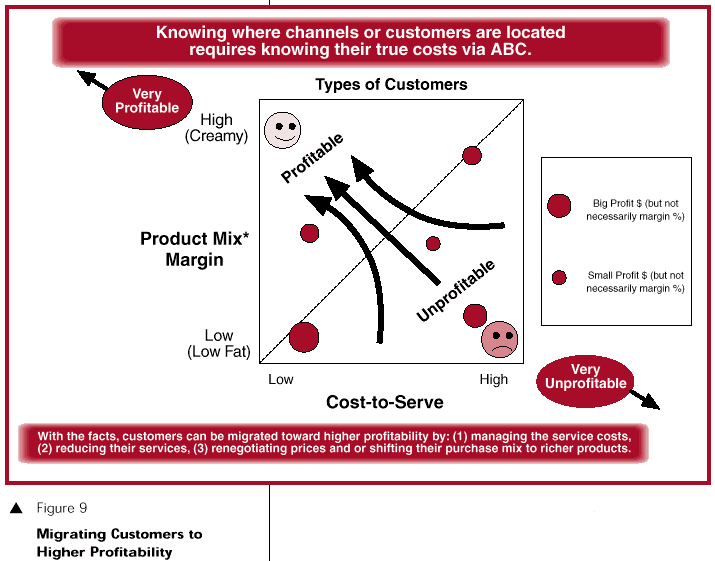
Knowing where customers are located on the matrix requires ABC/ M data.
Beware The Learning Organization
As progressive organizations, and some may be your competitors, gain proficiency
and mastery with the business intelligence provided by ABC, they can be
formidable. What those companies are recognizing is that each individual
customer affects the profitability of their branded products, base services and
market segments. The effect is due to the customer's purchasing habits, delivery
location, discount/ rebate structures or other diverse ways it places demands on
a supplier. When equipped with ABC's superior data, they can cherry-pick the
premium-profit customers, strategically price for new product entry, and even
send "false-signals" with price quotes deliberately set at levels to lose the
business so that their competitors will not suspect they have a far more
accurate quoting engine.
Future competitive differentiation will be based on the rate at which
organizations learn, not just the amount they learn. You do not want your
organization to be too late in understanding and mastering ABC as the route to
understanding your customer profitability.


