If you're looking for my POV-Ray include file MATH.INC, it can be downloaded from this page. MATH.INC allows the easy creation and rendering of an infinite variety of different 3-D graphs inside of POV-Ray. It turns POV-Ray into the ultimate graphing calculator! It can be used to create images similar to the ones on Page Three of the Raytracing Gallery.
As usual, click on the little images for a larger view. Now for the story...
Once upon a time I was doodling little mathematical images in DOS using simple two-dimensional, single color, black-and-white dot images. I wondered how I could get those dotty little images (like a graphing calculator) into a format where I could use them somewhere else, like, oh, a raytraced image. So, I decided to look into writing a function plotter which would output some kind of file which I could then raytrace. Unfortunately, I knew absolutely nothing about (1) reading 3-D file formats, (2) writing 3-D file formats, and (3) working in 3-D. Never one to let ignorance get in the way of progress, I went into my favorite 3-D DXF modeller and churned out the smallest, easiest sphere possible.
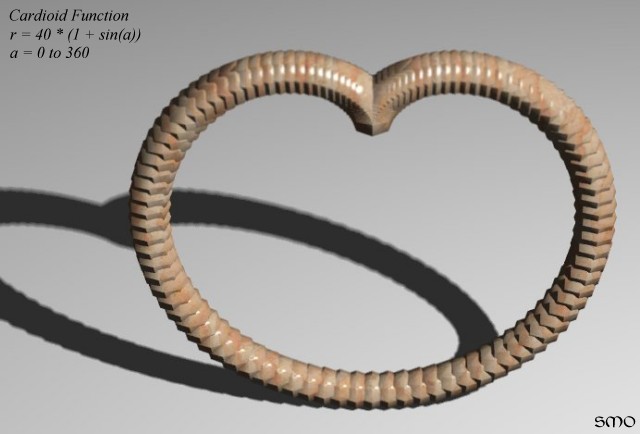
Then, all I needed to do was apply a simple 3-D transformation to the sphere and copy it lots and lots of times (once for each point to plot) and I was in business. Without going into detail, it was interesting trying to figure out how the heck DXF files are put together. But, in the end, I got an interesting result, albeit only quasi-three-dimensional. (It was still a two-dimensional plot, I didn't even need to get into the third dimension at all since the sphere is naturally a 3-D object.) The first image I made was a Polar curve called the Cardioid. (Click on the thumbnail for more information on the curve.)
But, unfortunately, this looked pretty bad and was hardly 3-D. Also, all the spheres it required took a lot of disk space and processing time. I thought of how I could attach each of the points with a line instead. In 3-D space, this would be best accomplished with attached cylinders. All I needed to do was form a ring of points around the first point to plot (x1,y1) and another around the second point to plot (x2,y2) and attach the points. And the more points I put in each of the rings, the smoother the cylinder. Perfect! Right?
Nope. The endcaps of the cylinders all pointed in the same direction (up and down), so if the line it was drawing was horizontal, the cylinders would "flatten out" as in this image.
So, I needed to figure out how to rotate the cylinders so the endcaps were perpendicular to the angle between the two points they were going between. Unfortunately, the language I'm working with (Turbo Pascal) only has one inverse trig function, so I had to make do. And here it is, along with two supporting functions:
 Function SafeDiv(x,y:real):real;
 begin
  if (y = 0.0) then safediv := 0 else safediv := x/y;
 end;
 Function Findquad(x,y:real):byte;
 begin
  if (y >= 0) and (x >= 0) then findquad := 1;
  if (y <= 0) and (x > 0) then findquad := 2;
  if (x <= 0) and (y <= 0) then findquad := 3;
  if (x < 0) and (y > 0) then findquad := 4;
 end;
 Function FindAngle(x1,y1,x2,y2:real):real;
 var quad : byte;
     temp : real;
     fix  : word;
 begin
  fix := 0;
  x1 := x2 - x1;
  y1 := y2 - y1;
  quad := findquad(x1,y1);
  if (quad = 2) or (quad = 4) then begin
   temp := x1;
   x1 := y1;
   y1 := temp;
  end;
  temp := abs(safediv(x1,y1));
  temp := rad2deg(arctan(temp));
  case quad of
   2 : fix := 90;
   3 : fix := 180;
   4 : fix := 270;
  end;
  findangle := temp + fix;
 end;
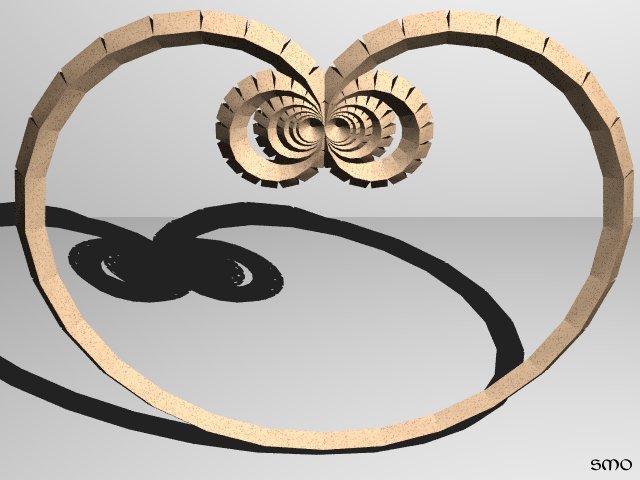
Looks really short and simple in the end, doesn't it? Well, this is an image with the cylinders angled "correctly." I was surprised when I first saw this, because instead of lots of seamlessly-connected cylinders, now I had solid cylinders with gaps in between. Why? Because each cylinder's pointing in a different direction, like sticking tin cans end on end at slightly different angles, leaving gaps.
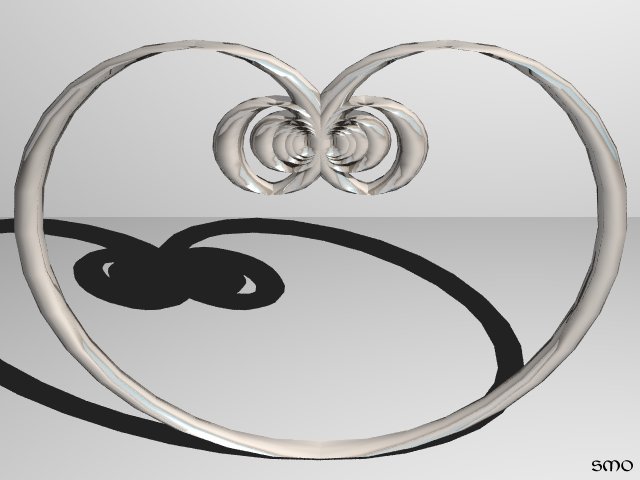
So, what I had to do was make sure the "caps" of the cylinders connected by changing the angle between each endcap on each cylinder, and it worked! Here's the final, seamlessly smooth product.
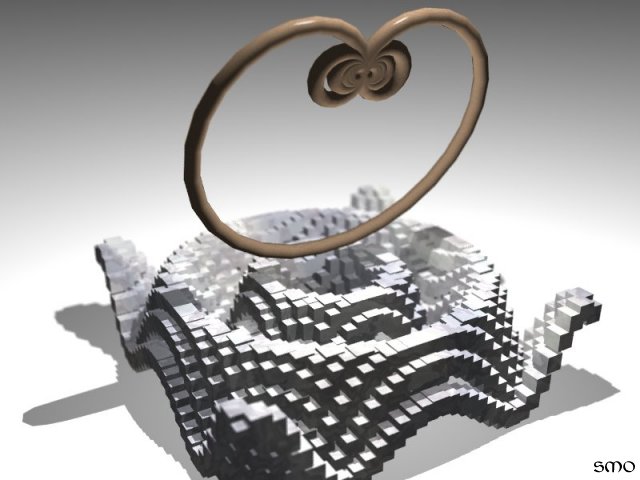
Using another technique, I made a 3-D point plotter which works with little cubes. Here's the cochleoid (spiral shape) curve with a graph of a 3-D sine wave function.
And here, in all their glory, four more graphs! The spiral at the top is the cochleoid, the sea-shell shape is (half of) the Fermat spiral, and the two cube-looking shapes are the 3-D sine function again. The sine function in the background was made with another method that acts more like a real bar graph, while the one in the foreground is a 3-D cubic plot. (Sorry about the camera getting out of focus there!)
Equations
Miscellaneous
Now wasn't that a nice story?
 Procedure Rotate3D(var x,y,z:real; ax,ay,az:real);
 { Rotate x,y,z around origin by ax,ay,az amount per axis.  X,Y,Z will
   be overwritten with the results.  Remember that they are in relation
   to 0,0,0. }
 var rx,ry,rz,rx1,rz1 : real;
 begin
  { X-axis rotation }
  ry := y * dcos(ax) - z * dsin(ax);
  rz := z * dcos(ax) + y * dsin(ax);
  { Y-axis rotation }
  rz1 := rz * dcos(ay) - x * dsin(ay);
  rx  := x * dcos(ay) + rz * dsin(ay);
  rz := rz1;   { The initial RZ needs to be used in the line above, so it
                 needed to be saved until then. }
  { Z-axis rotation }
  rx1 := rx * dcos(az) - ry * dsin(az);
  ry := ry * dcos(az) + rx * dsin(az);
  x := rx1;  y := ry;  z := rz1;
 end;
Polar-Cartesian conversion:x := r * cos(a);
y := r * sin(a);