Support by numbers…
|
Functions: Day Two |
|
|
Formulas Constructing formulas "if" statements Function Wizard Dates and times Add-ins Lookup functions Index-match |
|
Advanced Excel Work: Day Three |
Supporting Excel: Day Four |
|
Using resources Printing issues Common calls Corrupted documents Using Macros Recording and debugging macros Macro Virus Protection |
|
Think of spreadsheets as the world's greatest ledgers. Each item you enter in a ledger can be added or subtracted, an index number, a description, or a date. Basically, you can put anything into any section of this ledger. Each row and column is set up in a box-like grid, making it easier to find an item. If you have a spreadsheet which looks like this:
|
|
A |
B |
C |
D |
E |
F |
G |
|
1 |
|
|
|
|
|
|
|
|
2 |
|
|
My Info |
|
|
|
|
It would be easy enough to say "My info is in the third box over, the second box down", but wouldn't it be easier to say it's in C2?
A few common terms you may hear when supporting Excel:
File stuff you should remember
There are four primary cursors in Excel, each with their own purpose.
|
|
The main cursor is a thick white plus mark. It is used for selecting cells and ranges. |
||
|
|
Then there is the crosshairs cursor. It is used for the purposes of Drag and Fill. This cursor will only appear if Excel is set up to allow Drag and Drop (which it is by default). |
||
|
|
The third type of arrow is the selector cursor. It is used to select drawing objects as well as to drag cells by their border to a new location. |
||
|
|
The fourth type is the text editing cursor. It is pretty much the same type of cursor you would use in Word or in a PowerPoint text box. |
||
Now that you've got the ingredients, let's start cooking!
Drag and fill is a really great concept for people working with lists. Take this example: You're working with four little league teams over a five day period. The teams have not selected names yet and you have decided to let your top three players on each team have a try at being pitcher.
As you can see, there is a black square in the corner of the cell which reads Monday. If you place your cursor over the black square (called a "fill handle") it will turn into the crosshairs cursor. At that point, you can hold down on the left mouse button and drag the cell across the next four cells to the right. The result will look like this:

When you release the mouse button, the cells will fill in with the days of the week, as this is a predefined custom list in Excel. What that basically means is that Excel knows what comes next in this series. When you release the mouse button it looks like this:

The same logic applies when dealing with the Team Names:

If you drag the box down, it assumes you want to continue a series:
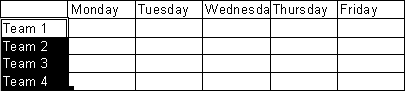
But suppose you wanted to only use team 1 and 2 and split the pitching duties. If you highlight Team 1 and Team 2, then drag down while using the CTRL key, it changes the way Excel fills this sheet.

The first type of fill is referred to as a linear fill, as the numbers follow a pattern like a straight line, increasing by the same amount each time (one day, or one team name). The second type is a series fill. The third type of fill we will now demonstrate is a growth fill, so named because the series grows incrementally as it is filling.
Remember grade school? There was a period when we were being taught our multiplication tables.

I'm going to start a multiplication table using linear fills.
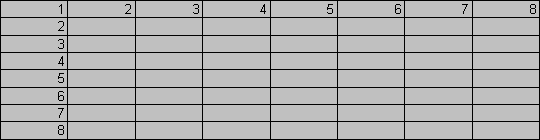
Then add a number 4 at the 2 x 2 area.

Then finish it off using Growth Fills.
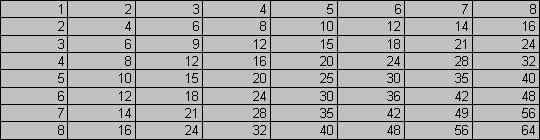
If it were only that easy in school!
But what happens if you drag and fill Formulas? Let's take a look:
|
|
A |
B |
C |
|
1 |
15 |
=A1 |
|
|
2 |
|
|
|
Now in the sheet above we have a formula in cell B1. The formula tells it to return the value in A1, so in this case, the value you would see in B1 is 15.
|
|
A |
B |
C |
|
1 |
15 |
=A1 |
|
|
2 |
|
|
|
This is an example of "relative referencing". The cells are reflecting the formula in relation to its original position. If you drag a cell over one column, the column reference changes by one letter. If you drag it across two columns, the reference changes by two letters. The same thing will happen if you drag a cell down rows as well.
So, how do you get around this if you need to? This is where we get into another aspect called "absolute referencing". By changing the formula to =$A$1, the formula will ALWAYS look in cell A1. The $ tells it which element to keep from changing. $A1 would keep the column A reference but would allow the row 1 reference to change if it were dragged to a new location. A$1 would allow the column A reference to change while keeping the row 1 reference. Any questions?

As you can see from this picture, you have a toolbar for just about everything. Literally. The Standard toolbar which has the New Workbook, Open Workbook, and Save buttons among others, and the Formatting toolbar which features the Font Name and Size drop down boxes are the most commonly used toolbars and are set up as the default. Other toolbars allow you to edit Pivot Tables, record macros, and create charts.
You'll also notice three options at the bottom. Color Toolbars (checked by default) which take up slightly more (not a noticeable amount of) memory, Large Buttons which makes toolbars easier to see, and Show ToolTips. ToolTips are the little yellow indicators that describe a button if you hover your mouse pointer over it for a second.
Above the options is a Toolbar Name box, used to identify a new toolbar you create. If you type a name in this box and press "Enter" or click OK, a new toolbar is created. If you click Customize… you can add new buttons to a toolbar by dragging them onto the toolbar. With the Customize window open, you can also right-click on a toolbar button and change what that button looks like or what the button does when it is clicked.

At the bottom of each page are tabs. Much like working with a Rolodex, each tab contains it's own information and can be easily flipped through by clicking on the tab name. (If you don't have a mouse, you can click through pages simply by using Ctrl-Page Down or Ctrl-Page Up.)
The Quick Navigation keys will scroll through the sheet tab names quickly and easily. These buttons (in order) are First Tab, Previous Tab, Next Tab, and Last Tab. These buttons do not select a sheet, but they allow you to see the sheets to choose from.
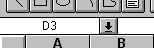
For a quick way to get to a certain cell, you can use the Name Box area just to the left of the Formula bar (at the top of the sheet, in the left hand corner) shown here:
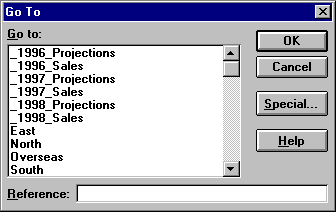
Another quick way to get from point "A" to point "B" is to use the Edit - Go To command (which can be abbreviated by using the F5 key).
This dialog box will show any named ranges, which can be used as a quick way to select the range. Another way to select a cell or range quickly is by entering a cell coordinates or range in the Reference box. When you press OK, the selection is highlighted!
This dialog box can also allow you to select items that are not visible ranges as well. Click Special and you get this box:
The Go To Special box allows you to select only cells with certain properties, such as only cells which have Notes attached, or only cells whose formulas generate errors.

If you have a formula which returns the error "Cannot change part of an array" when you go to change the value of a cell, you will need to select the entire array to change the formulas. The easiest way to do this is to select Current Array from this dialog. If you have selected a single cell and want to quickly select all the cells surrounding it, Current Region is the quick and easy way!
There are two quick and easy ways to select all the cells on a worksheet as well. The first is to use Windows' Select All key combination (Ctrl-A) or to select the button to the left of the letter A and above the number 1 on your worksheet. This will effectively select everything on your sheet.
But what if you want to see a section of your sheet while keeping another section visible as well? Let's do the splits!
|
|
|
Splits are fairly elusive if you don't know where to find them. They hide in the upper and lower right corners of your screen and appear as black bars in Excel 5.0 and previous, or gray bars in Excel 95 and 97. Just slide these little bars into your worksheet and you're ready to scroll! |
|
|
||
Cell formatting is the Baskin-Robbins of Excel. A flavor for any usage. Let's take a look at how a spreadsheet can be spiced up, twisted, shaked, rattled and rolled…
Now as you can see here, you can format many different aspects of a sheet. The Row and Columns allow for changing the height and width of cells. Ever see a cell filled with ###### symbols? This usually means that the cell is not wide enough. (I'd say in about 96% or so of all cases. Unofficially.)
Row and Column allow changes in height (or width), AutoFit (which allows Excel to choose the height or width based on the tallest/widest cell in the row/column), hide, unhide, and (for columns only) Standard Width.
Sheet allows you to hide, unhide, or rename a sheet, and in Excel 95 and 97, it even allows you to use a picture for a background!
AutoFormat allows you to choose from a series of predefined styles to change the appearance of a table.
Style allows you to set a definition of a format which can be applied by selecting that style. Say, for example, you want to have certain selected cells to appear in a different font, underlined, and in blue instead of black. You can set up a style with this formatting and apply it with just a few clicks without having to change each individual element every time.
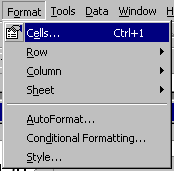
Cells is the biggie.
The first type of cell formatting is Number formatting. This allows you to choose how a number will be displayed in a cell.

Generalis the default setting and it is pretty much a "come as you are" setting. If you have a cell which isn't displaying properly, try setting it to General and see if this clears up your problem. If not, then there's more at work here.
Numberallows you to set the number of decimals to be shown and whether you want a comma as a separator for thousands, millions, etc. It also lets you choose whether you want brackets around negative numbers, or if you want the minus sign, or if you just want to turn them red.
Currencyis a lot like numbers except it assumes that you will always be using two decimal places and starting everything with a $ symbol. (You can change those defaults, though.)
Accounting
is Currency with an alignment based on the decimal point.Date and Time are pretty self explanatory. Basically, do you want March 30 or 3-30-98? Is it 1:30:43 PM or is it 13:30?
Percentage lets you set the number of decimal places to display. (5.9% APR or is it 5.85332%?)
Fraction allows you to display the number as a fraction instead of a decimal value. (.3333333 becomes 1/3.)
Scientific allows for scientific notation in a cell. (4,444,444,444 becomes 4.44E+09)
Text forces a cell to be read as having text in it as opposed to a number.
Special is for formatting items with dashes such as phone numbers and social security numbers.
And finally, Custom is used to create your own formatting. A few examples of custom formatting codes are:
|
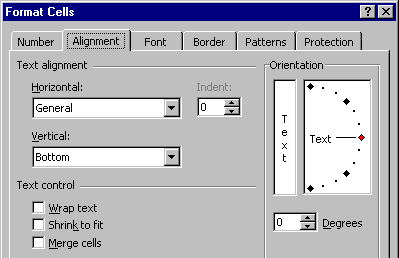
Alignment is the next formatting frontier. Here you choose where text will be displayed in a cell. Will it be on the left or right, top, center or bottom? Is it indented? Does it wrap down a cell? Does the text shrink to fit in the cell? All of these options are possible through alignment. You can also tilt your text in Excel 97. This is a new feature not in previous versions. This gives you two options. Either tilt it free-form using the guide or enter the degree of the tilt. |
|
|||
|
|
||||
|
Font allows you to choose the typeset and properties, much the same way you would in Word or PowerPoint. Nothing new here if you've used fonts before. |
||||
|
Border allows you to add borders to your cells, making them look more like a Table in Word. You can choose from any of the styles of border lines listed, as well as the color of these lines and which area you wish to place the border on. Top, Bottom, Left, Right, between cells, Outlining a group of cells, or diagonal line strike-throughs are available to choose from. |
|
|||
|
|
|
|||
|
Patterns allows you to select a color for the background of a cell, or if you select Pattern at the bottom of the screen, it will allow you to overlay a second color based on a pattern on top of the primary color, such as a checkerboard pattern. |
||||

The last type of formatting on cells is a new feature called Conditional Formatting. It only exists in Excel 97, but will allow you to format a cell's properties (font, background, border) based on conditions you set. If you want a cell with a value between 35 and 45 to be blue with red text and a double outlined green border, here's where you can make magic happen.