These tips and screenshots were taken by Chris Proctor, for use by his team. Any transcription mistakes are mine, not his!
OVERVIEW
The Distributed Debugger module from the IBM Websphere Development Tools allows the programmer to debug ILE objects in interactive or batch mode. The documentation that follows outlines the steps needed to debug an object.
Step 1 – Get the job number from your submitted or interactive session
The first step in debugging an application is to determine whether you are debugging an interactive job or a submitted job. If the job you wish to debug is a submitted job, it should be submitted on hold (HOLD(*YES)). Then you can display the submitted job and get the job number. If the application to be debugged is interactive, issue a DSPJOB command to get the job number of you interactive session.
Step 2 – Starting the Distributed Debugger
Select Start|Programs|IBM Websphere Development Tools for iSeries|IBM Distributed Debugger| IBM Distributed Debugger.
Step 3 – Selecting the job to debug
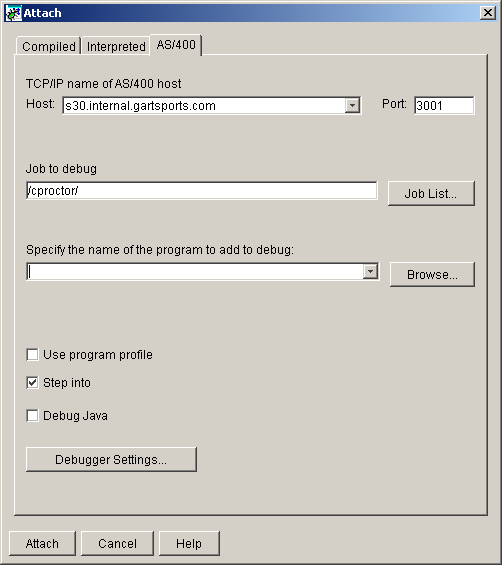
Figure 1.1
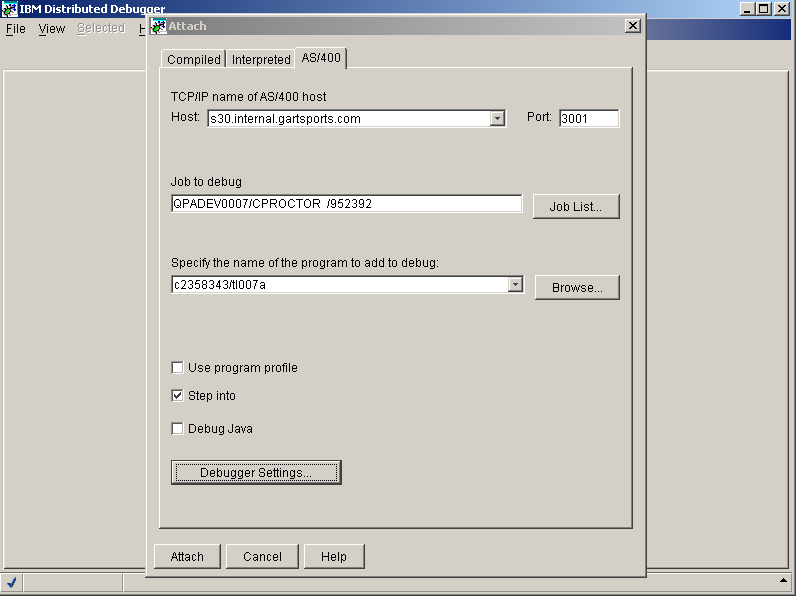
Once the debugger has started, the Attach window will appear as shown in figure 1.1. Enter your userID in the “Job to debug” field separated with slashes as shown above and click on the Job List button.
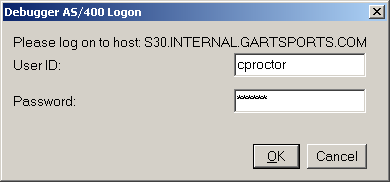
Figure 1.2
When the Debugger AS/400 Logon dialog appears, sign on to the AS/400.
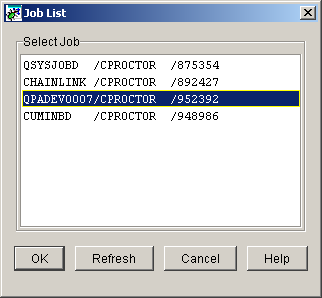
Figure 1.3
Once a valid sign on has been entered and the debugger connects to the AS/400 a dialog will appear displaying all active jobs associated with the userID you signed on with. Select the job associated with the batch job or interactive session you would like to debug and click on the OK button.
Step 4 – Selecting the application (or program) to debug
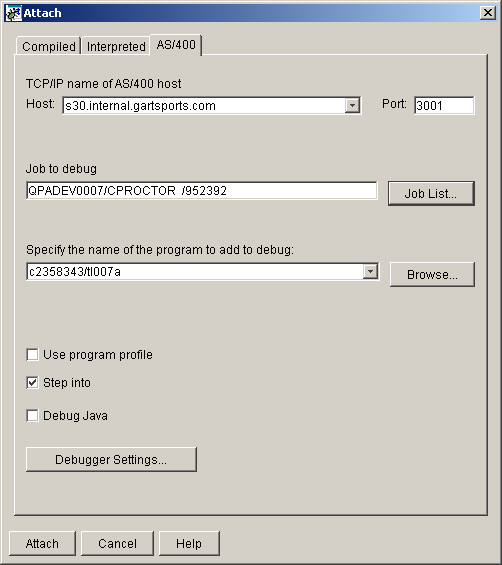
Figure 1.4
Next, enter the library/program name to add to debug as shown in figure 1.4. You may also click on the Browse button to select the program. Once you have entered the program name, select the “Step into” checkbox and deselect all other checkboxes. If the program you are debugging requires UPDPROD(*YES), click on the Debugger Settings button.
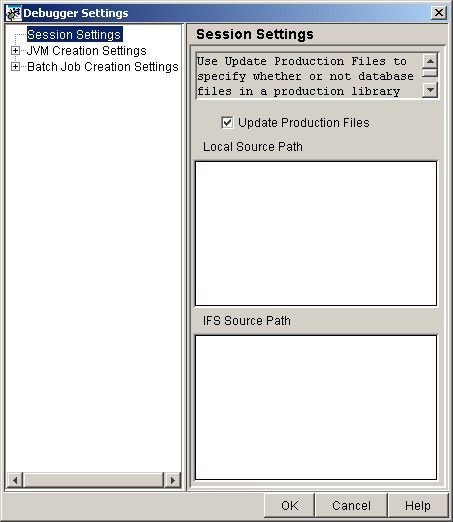
Figure 1.5
Select the Update Production Files checkbox if the program needs to update production files. Click on the OK button to return to the Attach dialog.
Step 5 – Attach the Debugger to the program
Figure
1.6
Attach to the program by clicking on the Attach button.

Figure 1.7
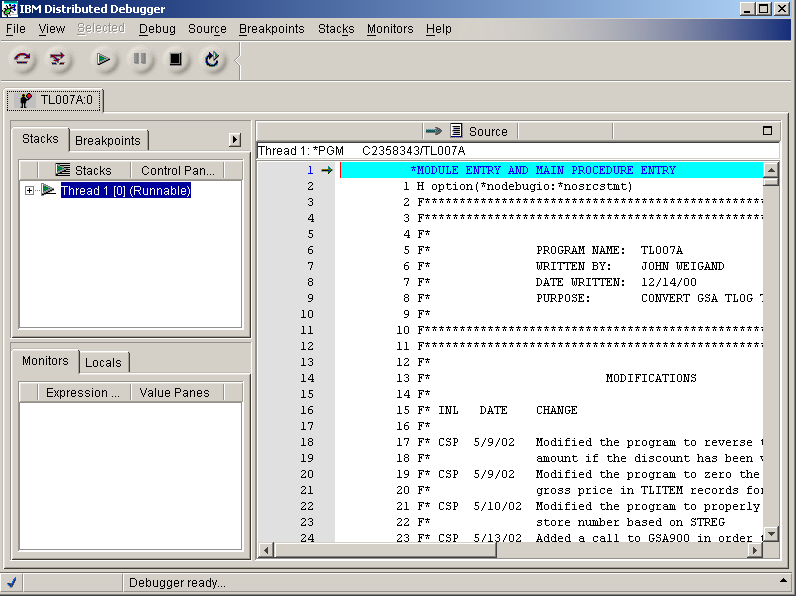
Figure 1.8
Once the debugger has attached to the program, the message displayed in figure 1.7 will appear if it is an interactive job. If the program to be debugged is a batch job, the debugger will release the job automatically and stop at the entry point into the program selected. At this point, for an interactive job, you should execute a CALL from your 5250 session for the program to be debugged, then click on the OK button in order to start the debug process.
Now the program is in debug and the Distributed Debugger is displayed. At this point you may now select variables to monitor and breakpoints.
Step 6 – Searching for text in a program
Figure
1.9
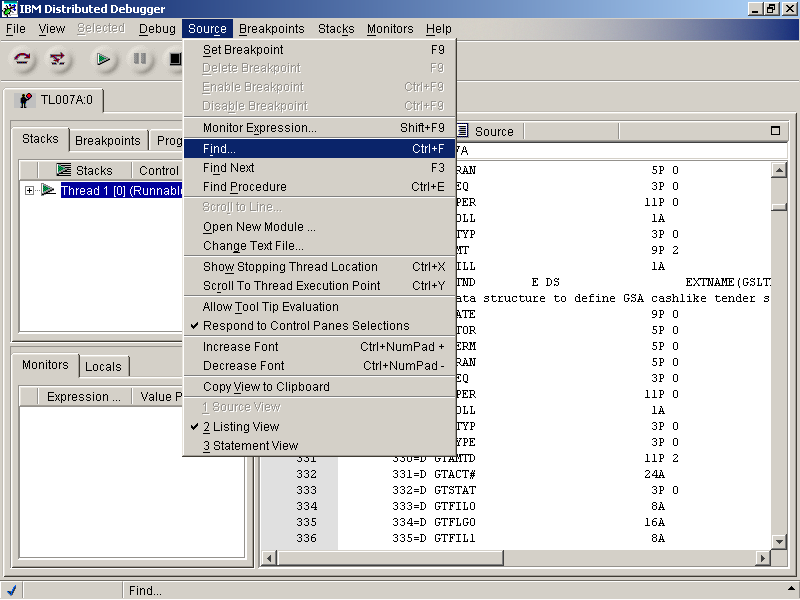
In order to search for text in the source member select Source|Find as shown in figure 1.9.
Figure
1.10
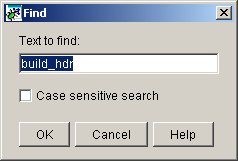
Enter the desired text and click on the OK button.
Figure
1.11
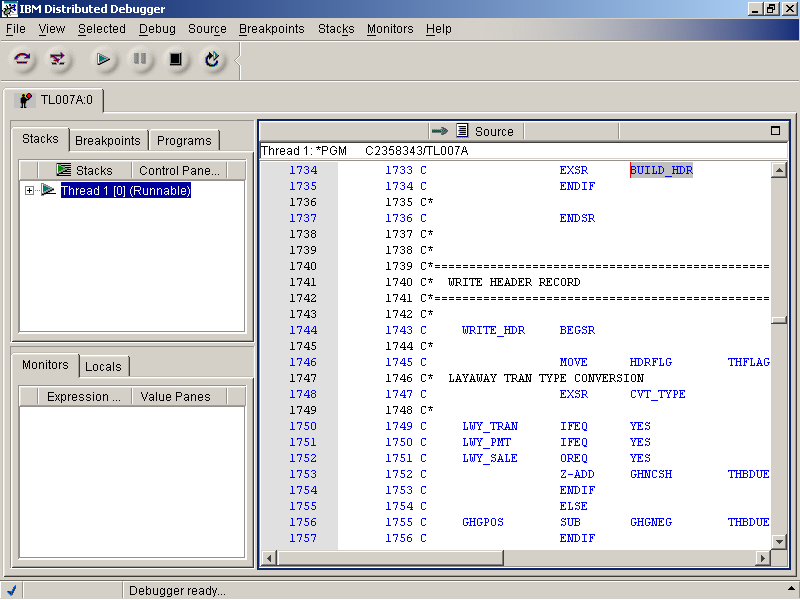
The search result will highlight the text if found in the source member as shown in figure 1.11.
Step 7 – Setting breakpoints
Figure 1.12
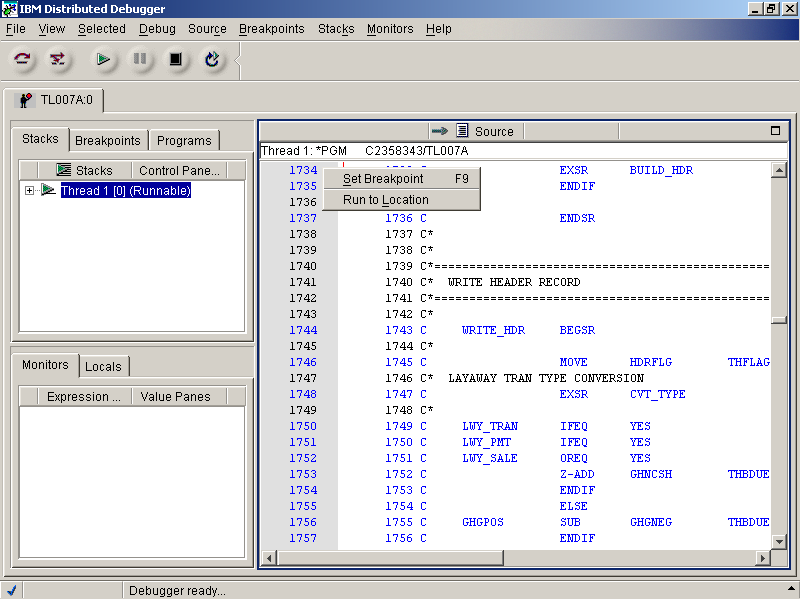
There are two ways of setting breakpoints. The first is to right-click on a line and select Set Breakpoint from the popup window (F9). The second method is to double-click on the line number in the gray area.
Figure
1.13
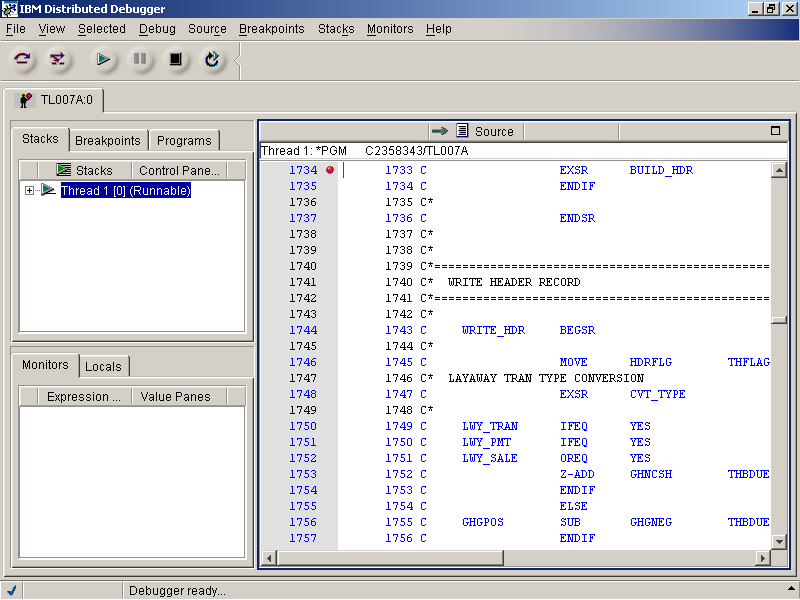
Breakpoints are distinguished by a red dot to the right of the line number as shown in figure 1.13. The breakpoint can be removed by either double-clicking on the line or right-clicking on the line and selecting Delete Breakpoint from the popup window.
Step 8 – Select variables to monitor
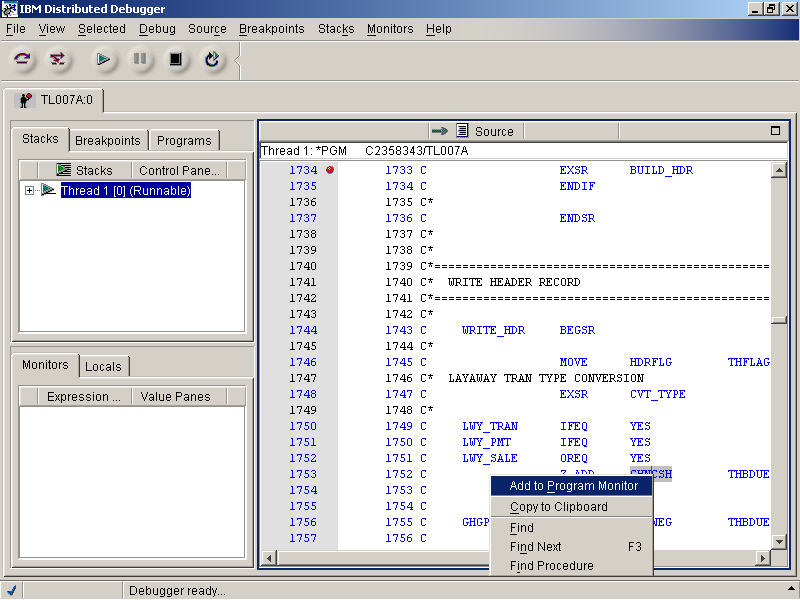
Figure 1.14
To select a variable to monitor, double-click on the variable to highlight it. Next, right-click on the variable and select Add to Program Monitor as shown in figure 1.14.
Step 8 – Select variables to monitor
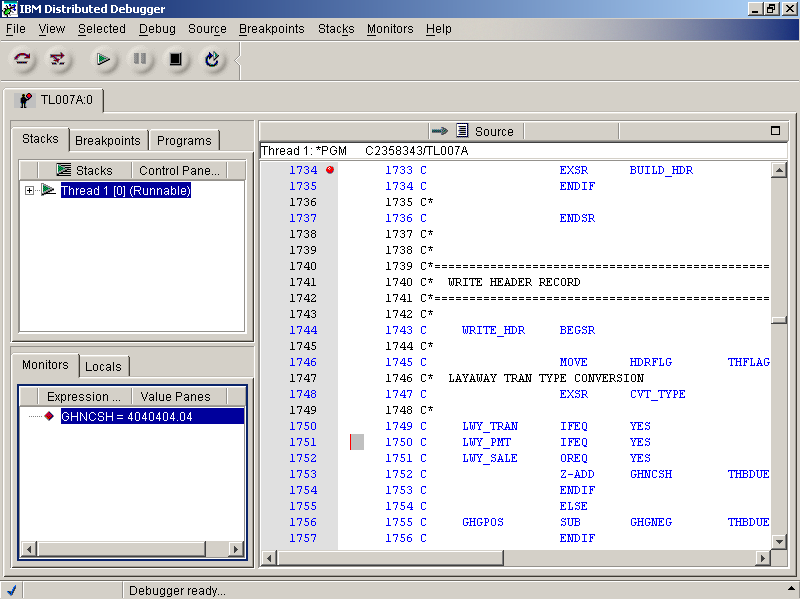
Figure 1.15
Once a variable is selected, it will appear in the Monitors pane in the lower left corner of the Distributed Debugger window. As this variable value changes it will be displayed in the Monitors pane. The value can be manually changed during the debug process by double-clicking on the variable and changing the value.
Step 8 – Stepping through the program
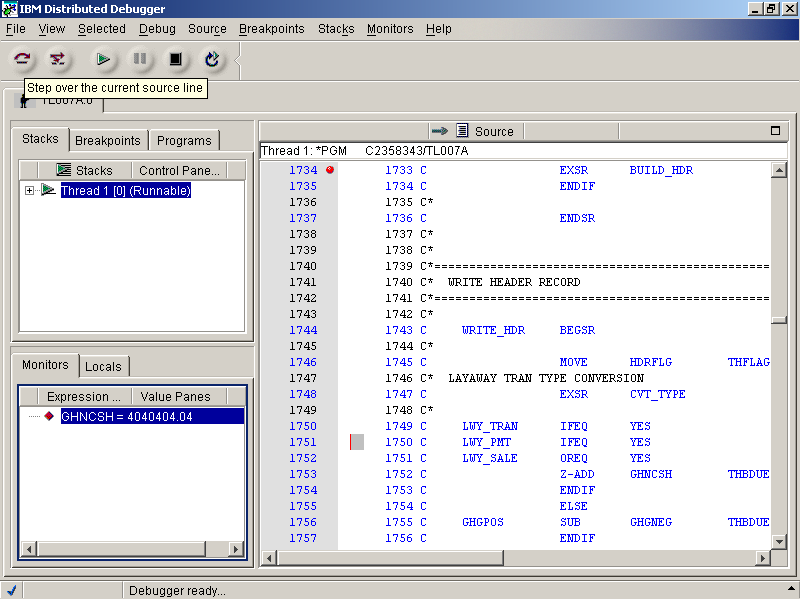
Figure 1.16
There are three (3) buttons on the toolbar used to step through a program. The first button is used to step through each line of code. (Figure 1.16)
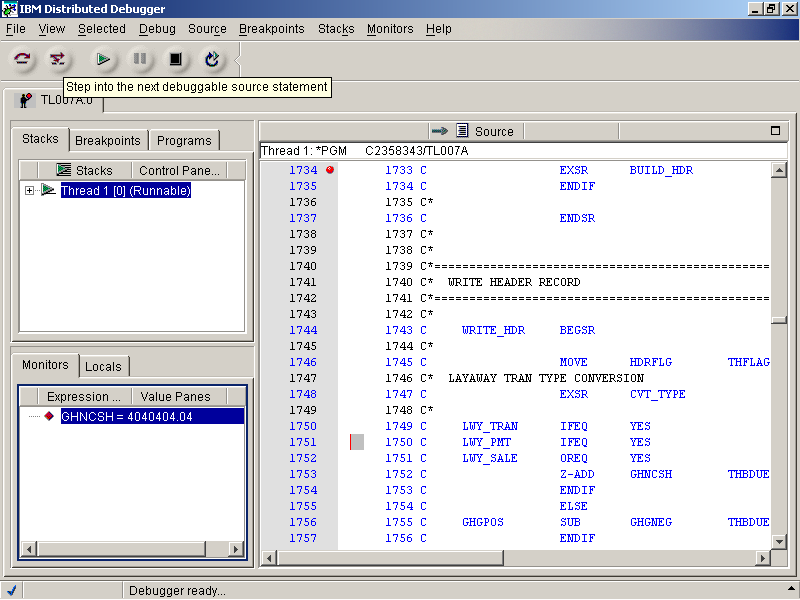
Figure 1.17
The second button will step into the next debuggable line of code. This button can be used to step into another program if it is called and is ILE (RPGLE, CLLE).

Figure
1.18
The third button will run the program until the next breakpoint is detected or the program terminates.
The fourth button pauses the debug process. This button can be very useful if a breakpoint is not reached and the program is running. It will allow you to pause the program and set additional breakpoints.
The fifth button ends the debug process.
The sixth button will immediately terminate the debug process and restart it with the same initial options.