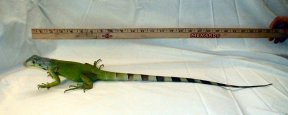
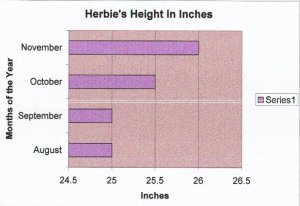
Every month we measure Herbie.
We measure him in inches.
We weigh him in pounds.
After we weigh and measure Herbie,
We can show that data on a graph.
When we work with graphing and charts we need to collect data.
Here are some sites to help us understand data collection.
BBC Data handling and Mean, Median, and Mode
Probability How to Collect and Interpret Data
Excellent activity on interpreting data.
Lesson on graphing points on a numberline.
Working with different types of graphs