.
Lesson 8 - Supply and Demand Analysis
|
|
|
Before students can study how international exchange rates,
students need to know how a market is defined, and which factors influence market prices and
quantities |
Demand
- The Consumers
|
| 1.
Demand Schedule - shows the
quantity and price of a good, which consumers are willing to buy, ceteris
paribus. Ceteris paribus is a Latin term that means we keep all
other factors constant. Only the price changes, so we can determine
the impact on quantity demanded.
Market Demand for Tea
(per year) |
Price
($ per pound) |
Quantity demanded
(1,000 kilograms) |
| $2.50 |
5 |
| $2.00 |
10 |
| $1.50 |
15 |
| $1.00 |
20 |
| $0.50 |
25 |
| Market Demand for Tea |
| Price |
 |
| Quantity (1,000 kilograms) |
-
Law
of Demand - as the market price increases, the quantity demanded
for a good decreases, ceteris paribus.
-
The demand curve has a
negative slope.
-
Price and quantity move
in opposite directions.
-
Why?
-
Common sense.
-
When products are expensive,
people buy less.
-
The principle behind business
discounts.
-
Law
of Diminishing Marginal Utility -
consuming additional units of a good yield less and less additional
utility i.e. satisfaction.
-
Example: Hypothetical.
-
1st Pepsi, a person
receives 100 utils (lots of satisfaction), so he values it at $1 per bottle.
-
2nd bottle, a person
receives 20 utils (some gain in utility), so he values it at $0.75 per
bottle.
-
3rd bottle, a person
receives 5 utils (very little gain in utility), so he values it at $0.25
per bottle.
-
Total utility = 125 utils;
total spent = $2
-
Composed of two effects.
-
Income
effect - as a product's price decreases,
a constant income buys more.
-
Real income increases.
-
Example: Monthly
income $1,000 and price of beef decreased.
-
Income effect - you can
buy more beef with fixed income.
-
Substitution
effect - as price of a product decreases, people start buying
it and “substitute away” from more expensive, similar goods.
-
Price change affects consumer's
behavior.
-
Example: As the
price decreases for Coca-Cola relative to Pepsi, people substitute Coke
for Pepsi.
2.
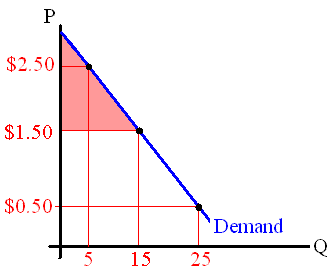
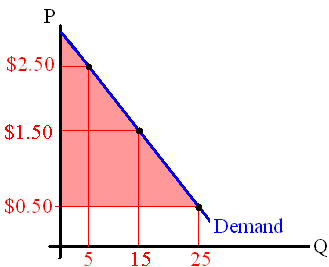
Consumer Surplus - the area
below the demand curve but above the actual price paid.
-
Measure of social welfare.
-
An aggregate benefit to
all consumers in the market.
-
The market price of tea is $1.50 and consumers buy 15 (thousand) kilograms.
-
I place a $2.50 value on
this game, but bought it for $1.50.
-
I received a benefit of
$1.00.
-
If the market price of tea decreases to $0.50, consumer surplus increases!
-
Social welfare increases
for consumers.
-
The red area is consumer
surplus.
| Demand for Tea |
Demand for Tea |
| Price |
Price |
 |
 |
| Quantity (in thousands) |
Quantity (in thousands) |
3. Elasticity
-
Elastic
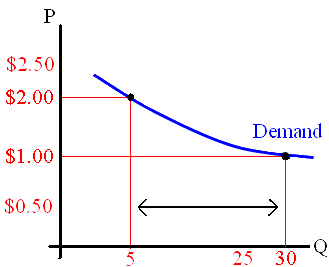
Demand Curves - quantity demanded is sensitive to price changes.
-
Demand curves are relatively
flat.
-
Many substitutes.
-
Large income effect.
-
Example: Air travel.
-
Inelastic
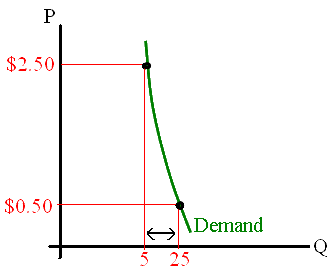
Demand Curves - quantity demanded is not sensitive to price
changes.
-
Demand curves are relatively
steep.
-
Few substitutes.
-
Small income effect.
-
Examples: Alcohol, cigarettes,
and gasoline.
| Elastic Demand Curve |
Inelastic Demand Curve |
| Price |
Price |
 |
 |
| Quantity Demanded |
Quantity Demanded |
|
Changes
in Demand Versus Changes in Quantity Demanded
|
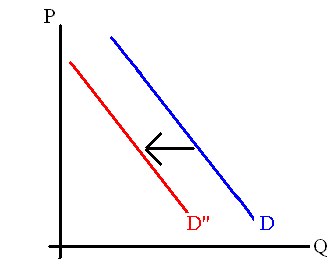
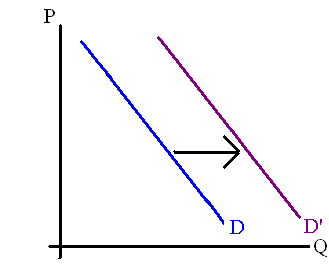
1. "Change
in Demand" - the demand curve shifts. Shift curves only
"left" or "right." Do not think of shifting curves "up" or "down."
| Demand Decreases |
Demand Increases |
 |
 |
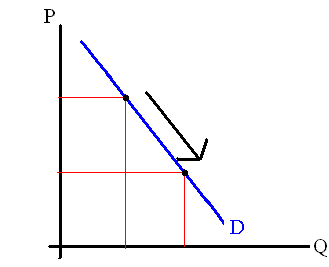
"Change
in Quantity Demanded" - movement along the same demand curve,
because the price changed.
| Movement along
Demand Curve |
 |
2. Shifting the
demand curve to the right; demand increases.
-
Income:
- Normal
good - as income increases, people have more money, and buy
more, ceteris paribus.
- Inferior
good - as income decreases, people have less money and buy more
inferior goods, ceteris paribus.
-
Number of consumers increases.
-
More consumers in the
market, the more they buy, ceteris paribus.
-
Price of other goods.
- Substitute
good's price increases.
- The price of chicken increases,
therefore, the demand increases for beef, ceteris paribus.
- Consumer's substitute
away from the more expensive good.
- Complement
good's price decreases.
- The price of DVD's decreases,
therefore, the demand for DVD players increases, ceteris paribus.
-
Expectations
- consumer expectations of future prices, future availability,
or future income.
-
If people believe tea
will become more expensive, then people buy more tea to "stock up," causing
the tea price to increase, ceteris paribus.
-
Demographic
changes - the average age in the U.S. is increasing, thus, older
people increase their demand for health care, ceteris paribus.
-
Changes
in consumer tastes and preferences - for example, a report stated
coffee reduced colon cancer, demand for coffee increases, ceteris paribus.
-
Weather
- if the summer is very hot, then people ddrink more soft drinks, ceteris
paribus.
 |
If the opposite occurs,
then the demand curves will shift left, i.e. decrease. |
|
Supply
- The Producers and Sellers
|
1.
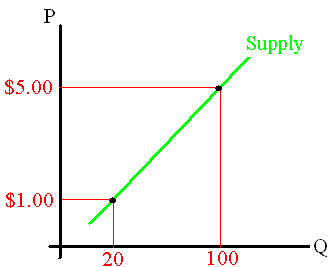
Supply schedule- shows the quantity and price of a good that
producers and sellers are willing to produce or sell, ceteris paribus.
-
Law
of Supply - as the good's price increases, then quality supplied
increases, ceteris paribus.
-
Supply curves have a positive
slope.
-
Why?
-
As the price increases,
the producers have an incentive to supply more goods.
-
Note - as production increases,
then production costs may also increase. The higher market price
off-sets the additional production costs.
| Producers' Supply of Tomatoes (per week) |
Price
($ per pound) |
Quantity supplied
(1,000 kilograms) |
| $5 |
100 |
| $4 |
80 |
| $3 |
60 |
| $2 |
40 |
| $1 |
20 |
| Supply Function |
| Price |
 |
| Quantity (1,000 kilograms) |
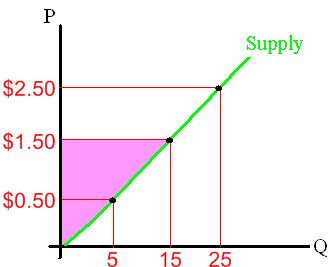
2. Producer
Surplus - the area above the supply curve but below the actual
sales price.
-
Measure of social welfare.
-
An aggregate benefit to
all producers in the market.
-
Some producers can supply tomatoes to the market for a price lower than $3.00
- These producers benefit and reflected in producer surplus
-
Equals total fixed costs
+ profits
-
The light purple area
on the graph.
| Supply for Tomatoes |
| Price |
 |
| Quantity (in thousands) |
3. Elasticity
-
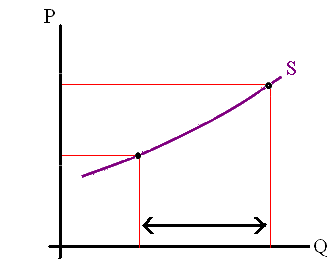
Elastic
Supply Curves - quantity supplied is sensitive to price changes.
-
Supply curves are relatively
flat.
-
Firms have time to change
plant size, invest in machines and equipment.
-
This is the long run.
-
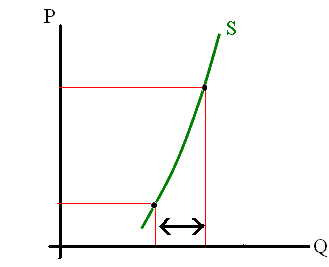
Inelastic
Supply Curves - quantity supplied is not sensitive to price
changes.
-
Supply curves are relatively
steep.
-
Firms do not have enough
time to change plant size or invests in new equipment.
-
This is the short run.
- Ex: The price of
computer chips increases.
- Short-run - If Intel is
operating below production capacity, then Intel can increase production
of chips more labor and resources.
- Long-run.- If Intel believes
the price increase is permanent, Intel can build a new factory to produce
chips.
| Elastic Supply Curve |
Inelastic Supply Curve |
| Price |
Price |
 |
 |
| Quantity Supplied |
Quantity Supplied |
|
Changes
in Supply Versus Changes in Quantity Supplied
|
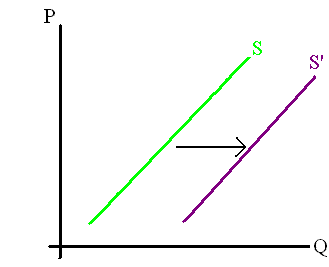
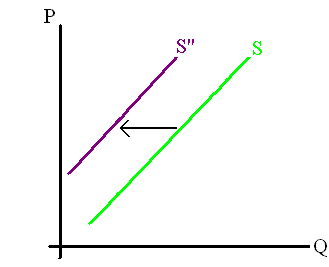
1. "Change
in Supply" - entire supply curve shifts. Shift curves
only "left" or "right." Do not think of shifting curves "up" or "down."
| Supply increases |
Supply decreases |
 |
 |
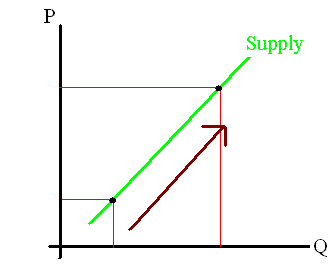
"Change
in Quantity Supplied" - movement along the same supply curve
in response to a price change.
| Movement along
Supply Curve |
 |
2. Shifting the
supply curve to the right; supply increases.
-
Resource prices.
-
Labor wages or resource
materials' price decreases, firms can supply more because of lower production
costs, ceteris paribus.
-
Technological advances.
-
Technology allows firms
to produce more output, using the same amount of resource inputs, ceteris
paribus.
-
Nature and political disruptions.
-
Favorable weather for
growing crops, resolving wars, etc, ceteris paribus.
-
Gov. decreases taxes or
increases subsidies.
-
Decrease business cost
and firms can provide more at each price.
-
Gov. decreases regulations
-
Compliance costs - Firms
have specialists who write government reports and ensure employees follow
regulations.
-
Also includes investment
into machines and equipment to comply with regulations.
-
Example - Electric power
companies have to lower air pollution by investing in machines that lower
pollution from smoke stacks.
-
Price of other goods.
-
Price for corn increases,
so soybean farmers start growing corn, ceteris paribus.
-
Producer's expectations
of future prices.
-
Firms expect sugar prices
to be lower next year. Some firms quickly sell this sugar this
year, which increases the supply for this year.
-
Number of sellers.
-
More sellers in the market
means more is produced.
 |
If the opposite occurs,
then the supply curves will shift left, i.e. decrease. |
|
How
Market Prices Are Determined
|
-
Market
- an institution that brings buyers and sellers together for
specific goods and services.
-
Examples:
-
New York Stock Exchange
- market for buyers and sellers of stock ffor well-known corporations.
-
Foreign currency market.
-
Commodity market.
-
Assumption:
-
The markets are perfectly
competitive, i.e. large number of independent buyers and sellers.
-
Equilibrium
- a state of rest; model does not change.<
| The Market for
Cookies |
 |
-
At
$2, quantity supplied = quantity demanded:
-
Equilibrium price = $2.
-
Equilibrium quantity =
10 units.
-
At
$3, quantity supplied > quantity demanded:
-
Surplus
-
Suppliers are producing
too much product, so price falls until it equals $2.
-
At
$1, quantity supplied < quantity demanded:
-
Shortage
-
Consumers demand more
than what is in stock, so they bid prices up until it equals $2.
|
How
Markets Respond to Changes in Supply and Demand
|
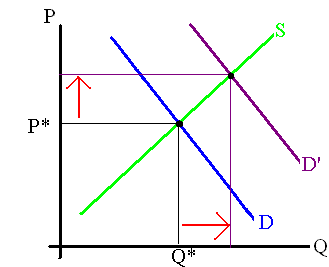
| Beef Market |
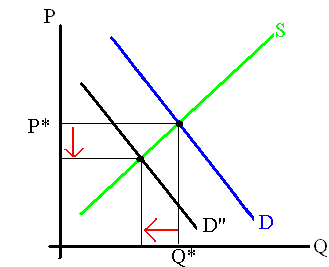
Soft Drink Market |
 |
 |
-
Price of chicken increases
(Substitute).
-
Demand for beef increases
(shifts right).
-
Consumers substitute beef
for chicken.
-
Both equilibrium price
and quantity increase.
|
-
Consumers experience an
unusual cold summer (Weather).
-
Demand decreases (shifts
left).
-
Both equilibrium price
and quantity decrease.
|
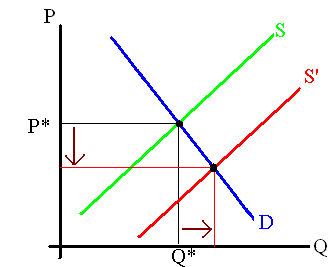
| Computer Market |
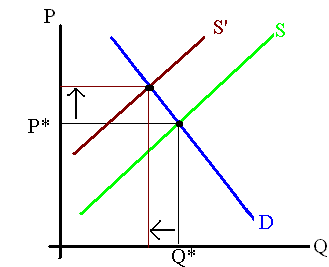
Automobile Market |
 |
 |
-
Technological advances
in making computer chips (Technology).
-
Supply increase (shifts
right).
-
"cheaper computer chips."
-
Equilibrium price decreases
-
Equilibrium quantity increases.
|
-
Labor unions are successful
in raising workers' wages at car factories.
-
Supply decreases (shifts
left).
-
Production cost increase.
-
Equilibrium price increases.
-
Equilibrium quantity decreases.
|
|
When
Two or More Factors Change
|
-
The next lesson introduces change in supply and demand!
-
If two factors change,
then either the change in market price (or market quantity) is known while
the other is indeterminate.
|
Invisible
Hand Principle - Adam Smith
|
-
Invisible
Hand - market prices direct individuals pursuing their own self-interest
into productive activities that also promote the economic well-being of
society.
-
Ex: A medical doctor
pursuing self-interest to become rich.
-
He cures people.
-
The people remain productive.
-
Society is better off!
-
Firms' interest
is to earn profits
-
Profits = Total Revenue
- Total Costs
-
Profit > 0
F Total revenue > total cost
-
Consumer's value > resource
value
-
Industry expands
-
Loss < 0
F
Total revenue < total cost.
-
Consumer's value <
resource value
-
Industry contracts
-
Resources should be used
to produce something else
-
Prices communicate information.
-
"Brings buyers and sellers
into harmony."
-
Example: There is
a surplus of apples. Sellers will lower price until all surplus apples
are sold (firms' profits may decrease)
-
Example: There is
a shortage of apples. Sellers will raise the price until shortage
disappears (firms' profits may increase).
-
Market prices affect millions
of consumers and producers around the world.
-
Impossible for government
to set prices correctly.
-
Shortages are common in
Socialist countries.
-
Market efficiency depends
on:
-
Competitive markets.
-
Well-defined private property
rights.
-
Social Welfare is highest
= Consumer surplus + producer surplus.
|


