Lesson 5: Determining Market Interest Rates
Upon completion of this lesson, you should be able to do the following:
- Describe how the supply and demand for bonds influence the market interest rates and bond prices.
- Identify the factors that shift the supply and demand curves for the bond market and how these shifts change the market interest rates and bond prices.
- Explain why interest rates are high during a business cycle, using demand and supply in the bond markets.
- Describe how changes in the demand and supply in the bond market leads to the Fisher Effect.
- Explain how the world's real interest rate cause loanable funds to enter or leave a country.
Introduction
This lesson examines the factors that determine the interest rate. Interest rates have been fluctuating substantially in the United States during the second half of the 20th century. For example, interest rates on 3-month T-bills were 1% in the early 1950s. Then in 1981, the interest rates on T-bills increased to over 15% and then fell to below 6% in the mid-1980s and 1990s. This lesson explains the behavior of interest rates.
Supply and Demand for Bonds
The interest rate in the bond market is determined by supply and demand for bonds. The bond is considered the good. Investors will buy bonds, while businesses and government will supply bonds. The market price of bonds and the quantity bought and sold will be determined in the bond market.
|
The Demand Curve for the Bond Market
|
|
The Supply Curve for the Bond Market
|
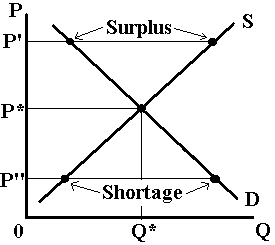
At the equilibrium point, the market is
at rest and prices and quantity for the bond market will not change.
|
Equilibrium for the Bond Market
|
- What happens to the market, if the price of bonds is lower than the equilibrium price? The quantity supplied is less than quantity demanded, which is called a shortage. The bond prices are low and interest rates are high, so investors have a large demand for bonds; the bonds are a good investment. However, businesses and government do not want to sell bonds for a low price and high interest rate. The price of bonds have to increase until equilibrium is restored at P* again (market interest rates decrease). The market is always in equilibrium and shortages and surpluses are always eliminated.
Shifting Curves
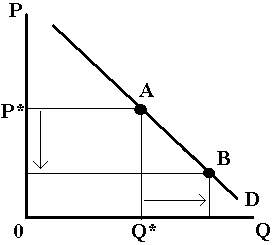
The demand curve can shift, because other
factors outside of the model can change. Please know the difference between a movement
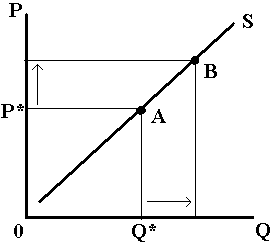
along a demand curve and a demand curve shift. Looking at the next example, investors
demand more bonds as we move from point A to point B. Economists call this a change in
"quantity demanded." Investors increase quantity demanded, because the price of
bonds became cheaper. Nothing changed in the model. If some outside factor changes, then
the demand curve will shift. Economists call a shift to the right as an "increase in
demand," while a shift to the left is a "decrease in demand."
| Movement along a demand curve | Demand curve shifts |
|---|---|
 |
 |
There are six factors that cause the
demand curve to shift. The factors will be listed in a way that cause the demand curve to
increase and shift to the right. When investors increase their demand for bonds, the
following will occur in the bond market:
|
Increase in Demand for
Bonds
|
- Increase in wealth - will cause the demand curve to shift right. When an economy is growing, wealth is increasing. The demand for bonds increases too, because investors and the people have more wealth and will invest more in the bond market.
- Decrease in the expected returns - on investment will cause the demand curve to shift right. If investors believe the interest rates will be lower in the future, then investors will buy more bonds. For example, if you believe interest rates are going to decrease in the future, then the bond prices would increase. You will buy bonds now, because you will be buying bonds for a cheap price (high interest rate) and resell the bonds in the future for a higher price, when market interest rate decrease.
- Decrease in expected inflation - will cause the demand curve to shift right. Inflation erodes the purchasing power of households, businesses, and governments. Inflation also erodes the value of investments, such as stocks and bonds. Investors will invest less, if they believe the inflation rate will increase, especially long-term investments likes bonds. The converse is also true. If investors believe inflation will decrease in the future, then investors will increase their investment in bonds.
- Ddecrease in the risk - of bonds will cause the demand curve to shift to the right. Investors want to loan their funds to borrowers, who will not default on their loans. Investors are risk averse. If investors believe the bond market becomes more stable and "safer," then the investors will buy more bonds.
- Increase in the liquidity - of the bond market will cause the demand curve to shift to the right. Investors are attracted to bonds that are liquid. The future is uncertain and investors want the ability to sell an asset fast for little transaction cost. If the bond market becomes more liquid, such as U.S. government securities, then investors will increase their demand for U.S. government bonds.
- Decrease in information costs - will cause the demand curve to shift to the right. Investors continuously need information, so they can evaluate their investments. For example, firms like Standard & Poor's evaluate the financial strength of large corporations and the corporations' ability to pay their debts. The information costs for large corporations are low, causing a higher demand for bonds of large corporations.
Please note that the demand curve can shift to the left. The same six factors are responsible and you only have to reverse the logic for the six factors. For example, an increase in expected inflation will cause the demand curve to decrease and shift left. The bond price decreases and interest rate increases.
There are four factors that cause the
supply curve to shift. The factors will be listed in a way that cause the supply curve to
increase and shift to the right. When businesses and government issue more bonds, the
following will occur in the bond market:
|
Increase in Supply for
Bonds
|
- Increase in expected profits - will cause the supply to increase and shift to the right. A business is willing to borrow and increase its outstanding debt to buy assets like machines and equipment, if the business expects to increase profits. Usually businesses issue bonds for machines and equipment during business cycle, because of the expectations of profit. The opposite occurs during recessions.
- Decrease in business taxes - will cause the supply of bonds to increase and shift to the right. If a business is subjected to high taxes, then the business has a low incentive to invest in machines and equipment nor expand production. More investment, such as borrowing funds through the bond market, cause the firm to be bigger and hence subjected to more taxes. If government lowers the tax burden on businesses, businesses may invest more by using bonds, causing the supply of bonds to increase and to shift right.
- Increase in expected inflation - will cause the supply of bonds to increase and shift to the right. Inflation erodes the value of the dollar, so over time, the value of debt decreases. If businesses and government believe inflation will become higher, they are willing to borrow more funds by issuing bonds. They can repay their loans with "cheaper" dollars.
- Increase in government borrowing - will cause the supply of bonds to increase and shift to the right. When government spends more than what it collects in taxes, the government can borrow by issuing government bonds. The United State federal government has had budget deficits for the last 30 years. Each year, the U.S. government issues more debt (and bonds) and the supply of bonds keeps increasing. Increasing the supply of bonds causes bond prices to be low and interest rates to be high. The market interest rates have been higher in the last 30 years than during the 1950s and 1960s, when the U.S. government had balanced budgets.
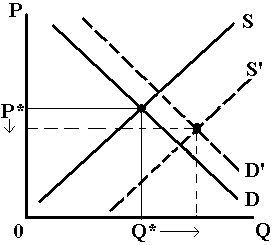
Business Cycles The empirical evidence indicates that market interest rates tend to rise during a business cycle and fall during recessions. During a business cycle, the amount of goods and services produced in the economy increases. Businesses are optimistic about future profits and will invest in machines and equipment by issuing more bonds. The supply of bonds increases. If an economy produces more goods and services, the economy has more wealth. Investors will save more and invest in the financial markets. The demand for bonds increases and the demand curve shifts to the left. The shift of the demand and supply curves cause bond prices to decrease, interest rates to increase, and the quantity of bonds in the market to increase. |
The Bond Market during a
Business Cycle
|
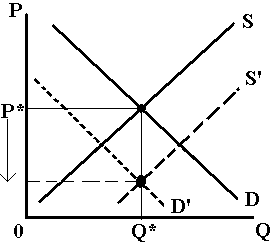
Fisher Effect The Fisher Effect can be explained by using the bond market. If investors and businesses expect higher inflation in the future, then investors buy less bonds and businesses are willing to sell more bonds. The demand for bonds shifts to the left, while the supply for bonds shifts to the right. The result is the price of bonds decreases and the interest rates increases. In this case, the amount of bonds (Q*) in the market is ambiguous. You can prove this by shifting the demand curve by a lot and shift the supply curve by a little. Then shift the demand curve by a little and the supply curve by a lot. |
The Fisher Effect
|
i = r +
peIn the previous models, the bond was considered the good in the market. However, there is another analysis that uses the loanable funds as the good. The bond market and loanable funds markets will give the same results; it is another way at looking at the same picture. Here is the difference between the two models. If an investor wants to buy bonds, then he has a demand for bonds. However, the investor is a source of loanable funds, because he will trade funds for a bond. The investor is the supply curve in the loanable funds market. If a business or government wants to sell bonds, then this means it needs (i.e. demands) funds. The business or government will issue a bond for funds. The business or government is the demand curve for loanable funds. The price in the loanable funds market is the interest rate and the quantity is the amount of loanable funds.
International Market Model The previous examples looked at the bond market as a closed economy. A closed economy has no financial transactions with other countries; it is isolated. The next model allows international investors into the market. This is called an open economy. This model will use the loanable funds approach. The quantity will be the amount of loanable funds, while the price will be the real interest rate. The real interest rate will be used, because every country has a different inflation rate. The real interest rate could be the same for all countries; however the nominal interest rates will be different, because each country has different inflation rates. |
International Market
Loanable Funds
|
This example assumes the country is a small open economy. This country is too small to influence the world's real interest rate. Many countries, like the Netherlands and Belgium would fall into this category. However, a country like the United States, Germany, or Japan with a large economy could affect the world's real interest rate.
If you find the loanable funds and bond markets confusing, just know how the bond market works for a closed economy and how the loanable funds market works for the small open economy.
