 |
Home | Contact Us | Open Account | ||
| Services | Education | News | Trading Tools | FAQ | | |||
|
Home | Contact Us | Open Account | ||
| Services | Education | News | Trading Tools | FAQ | | |||
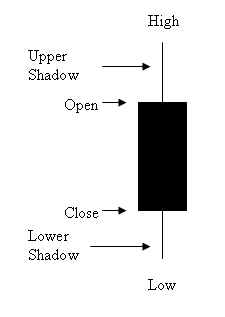
| How to read a Candlestick Price Chart Most of the price charts in this website are Candlestick charts. The two diagrams below show that the candle line consists of a rectangular section and two thin lines above or below this section. We see why these are named candlestick charts; the individual lines often look like candles with thier wicks. The rectangular part of the candlestick line is called the real body. It represents the range between the session's open and close. When the real body is black (e.g., filled in), it shows that the close of the session was lower than the open. If the real body is white (that is, empty), it means the close was higher than the open.
The thin lines above and below the real body are the shadows. The shadows represent the session's price extremes. The shadow above the real body is referred to as the upper shadow and the shadow under the real body is the lower shadow. Accordingly, the peak of the upper shadow is the high of the session and the bottom of the lower shadow is the low of the session. Candle charts can be used throughout the trading spectrum, from daily, to weekly, and intra-day charting. For a daily chart, one would use the open, high, low, and close of the session. For a weekly chart, the candle would be composed of Monday's open, then the high and low of the week, and Friday's close. On an intra-day basis, it would be the open, high, low, and close for the chosen time period (i.e., hourly). The left diagram above shows a strong session in which the market opened near the low and closed near its high. We know that the close is higher than the open because of the white real body. The right diagram illustrates a long black candlestick. This is a bearish session in which the market opened near its high and closed near its low. Commodity and Futures Education
|
Home | Site Map | Disclaimer | Privacy | Contact Us | Bookmark This Page |
Futures Trading involves substantial risk of loss and is not suitable for all investors. |