Quadratic functions
Definition
f(x) = ax2 + bx + c
Graph
The graph of a quadratic function is a parabola.
The vertex of a parabola has coordinates
x = -b/(2a)
y = f(-b/(2a))
If a > 0 the parabola opens up.
If a < 0 the parabola opens down.
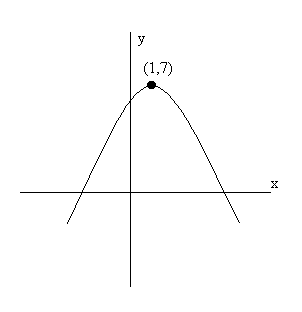
Example: Sketch a graph of f(x) = -2 x2 + 4 x + 5.
To locate the vertex we compute
x = -b/(2a) = -4/(2(-2)) = 1
y = f(1) = -2(12) + 4(1) + 5 = 7
Since a < 0 the parabola opens down.

Business applications.
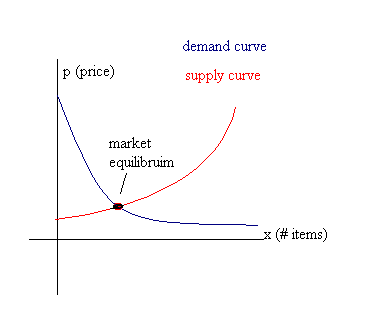
Supply and demand equations
The supply curve p = D(x) decreases: If the price increases the demand decreases.
The supply curve p = S(x) increases: If the price increases the supply increases.
Compute the market equilibrium by setting D(x) = S(x).

Example: Given the demand equation p = 60 - 2x2 and the supply equation
p = x2 + 9x + 30 where x represents the quantity in units of 1000.
a) Determine the quantity demanded when the price is $10.
b) Determine the price at which the supplier will provide 3000 units.
c) Determine the equilibruim quantity and price.
a) Use the demand equation, set p = 10 and solve for x.
   10 = 60 - 2 x2, 2 x2 = 50, x2 = 25, x = 5
   The demand is 5000 units.
b) Use the supply equation, set x = 3 and solve for p.
   p = 32 + 9(3) + 30 = $66
c) Set the demand = supply.
   60 - 2x2 = x2 + 9x + 30
   3 x2 + 9x - 30 = 0, x2 + 3x - 10 = 0, (x+5)(x-2) = 0
   Note x = -5 is rejected since we cannot have a negative
   demand.  Use x = 2.  p = 60 - 2(22) = 52.  Hence, the
   market equilibrium is at the point (x = 2, p = $52) OR
   (2000 units, $52).
Exercises
| Table of Contents |
| Previous |
| Next |

