Regression Oscillator rev.

| SMART SCAN REPORT | ||||
| Executed March 2, 1997; 09:44 AM - Scanned last 60 periods. | ||||
| Trading Systems: Enabled, Custom Alerts: Enabled, Percent Change: Disabled | ||||
| % Change settings: Close = 0.000%, High = 0.000%, Low = 0.000%, Volume = 0.000% | ||||
| Scan executed on 0 charts and 202 securities. | ||||
| System Net $ | ||||
| 01/22/97 - | COMVERSE TECHNOL] | Sell | at 45.50 | 14764.61 |
| 01/28/97 - | EMPLOYEE SOLUTIO] | Sell | at 22.63 | 14282.34 |
| 01/27/97 - | COMPUWARE CORP] | Sell | at 65.50 | 14255.28 |
| 02/14/97 - | SIMPSON MFG INC] | Sell | at 29.00 | 11816.37 |
| 02/04/97 - | FIRST USA INC] | Sell | at 50.50 | 11552.05 |
| 02/10/97 - | TARO PHARMACEUTI] | Sell | at 11.13 | 10253.35 |
| 12/30/96 - | PIONEER FINL SVC] | Sell | at 25.00 | 6808.92 |
| 12/11/96 - | HON INDS INC] | Sell | at 34.63 | 6714.65 |
| 01/29/97 - | MICREL INC] | Buy | at 34.75 | 6507.47 |
| 01/22/97 - | BRIGHTPOINT INC] | Buy | at 27.75 | 6270.33 |
| 01/31/97 - | STUDIO PLUS HOTE] | Sell | at 21.75 | 6120.34 |
| 01/20/97 - | ITT EDUCATIONAL] | Sell | at 25.38 | 6063.31 |
| 12/10/96 - | GATEWAY 2000 INC] | Sell | at 58.88 | 4809.22 |
| 01/29/97 - | MAXSERV INC] | Buy | at 7.13 | 3983.64 |
| 01/02/97 - | STANLEY FURNITUR] | Sell | at 19.00 | 3863.44 |
| 01/17/97 - | UNITED WASTE SYS] | Sell | at 36.25 | 3785.64 |
| 01/10/97 - | SPECIALTY PAPERB] | Sell | at 23.00 | 3414.29 |
| 12/30/96 - | WESTCAST INDS IN] | Buy | at 22.00 | 3294.10 |
| 02/24/97 - | CULP INC] | Sell | at 18.63 | 3238.13 |
| 12/17/96 - | AZTEC MFG CO] | Sell | at 7.88 | 3016.88 |
| 12/23/96 - | TEL-SAVE HLDGS I] | Sell | at 12.25 | 2286.08 |
| 01/07/97 - | TEVA PHARMACEUTI] | Sell | at 53.25 | 2196.49 |
| 12/11/96 - | COMPUTER LEARNIN] | Sell | at 27.50 | 2033.75 |
| 01/30/97 - | HEICO CORP NEW] | Buy | at 22.88 | 1984.44 |
| 02/12/97 - | HALIFAX CORP] | Sell | at 12.75 | 1810.50 |
| 01/29/97 - | COMP DE TELECOMM] | Buy | at 25.13 | 1606.92 |
| 02/12/97 - | MACDERMID INC] | Sell | at 38.00 | 1379.34 |
| 02/25/97 - | THERAGENICS CORP] | Buy | at 26.00 | 1332.69 |
| 02/11/97 - | AVERT INC] | Buy | at 7.19 | 569.29 |
| 01/02/97 - | CLEAR CHANNEL CO] | Sell | at 34.75 | -1328.03 |
| 01/16/97 - | HOLLYWOOD ENTMT] | Sell | at 21.63 | -2346.07 |
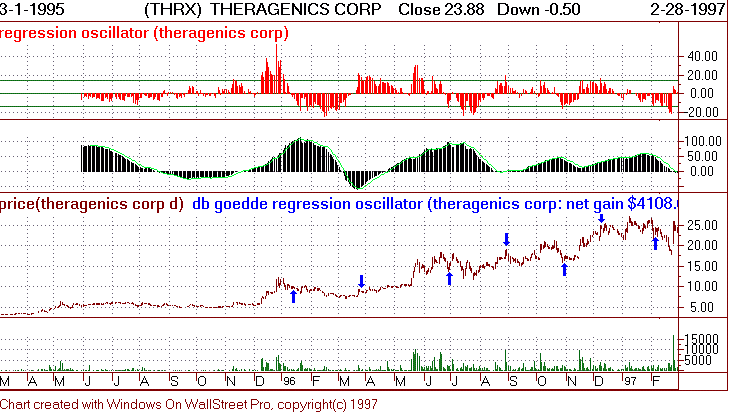
In MetaStock 6.0 it's easy to create the Regression Oscillator and the Slope/Close Indicator from Richard Goedde's article, "Market timing with the regression oscillator", which appears in the March97 issue of Technical Analysis Stocks and Commodities magazine.
First choose Indicator Builder from the Tools menu and enter the following formulas:
Regression Oscillator
100 * (CLOSE/ LinearReg(CLOSE,63)-1)
Slope/Close
10000* LinRegSlope(CLOSE,63)/CLOSE
Next drag each of these formulas from the Indicator QuickList and drop them on the heading of a
chart. To create horizontal lines, click the right mouse button while the mouse pointer is positioned
over the Regression Oscillator to display the shortcut menu. Choose Regression Oscillator
Properties. On the Horizontal lines page add horizontal lines at 14, 0, and -14. You can use The Explorer to perform the screen mentioned in the article.
First choose The Explorer from the Tools menu, next create a new Exploration with the following information:
Column A
Name: Reg Osc
Formula: Fml("Regression Oscillator")
Column B
Name: Slp/Cls
Formula: Fml("Slope/Close")
Filter
Formula: ColB > 50 and ColA >-15 and ColA < -5
Choose OK and then Explore to run the Exploration.
For MetaStock for Windows 5.x users the instructions are the same except enter the following custom indicator in place the ones mentioned earlier.
Regression Oscillator
100 * (CLOSE/ ((63 * Sum(Cum(1) * C,63) - Sum(Cum(1),63) * Sum(C,63)) /
(63 *
Sum(Pwr(Cum(1),2),63) - Pwr(Sum(Cum(1),63),2)) * Cum(1) + (Mov(C,63,S) -
Mov(Cum(1),63,S) * (63 * Sum(Cum(1) * C,63) - Sum(Cum(1),63) *
Sum(C,63)) / (63 *
Sum(Pwr(Cum(1),2),63) - Pwr(Sum(Cum(1),63),2))))-1)
Slope/Close
10000* ((63 * Sum(Cum(1) * C,63) - Sum(Cum(1),63) * Sum(C,63)) / (63 *Sum(Pwr(Cum(1),2),63) - Pwr(Sum(Cum(1),63),2)))/CLOSE