FOR THE RECORD.....................................since January 16, 1997
This page chronicles the Prudent Trader's track record. Each day the Prudent Trader comments in advance* about price points and what to do when they are reached. Ideally, the Prudent Trader has to envision the possibility of a 10 point move in the OEX index or 5 point move in the XAU index in order to open a position. This page will graphically illustrate what happened after the index's entry price point was reached. You will be able to compare the two. See for yourself if the Trailing Indicator, Deaner Indicator and price points selected by the Prudent Trader can lead you to painless profitability. Simply count the number of index points that followed the signal. Movement in the predicted direction will be logged as positive (+) points and point's leading up to the stop loss signal (if it is triggered) will be logged as negative points(-)**. Also important, but often overlooked is the number of times the Prudent Trader's Trailing Indicator prevents you from losing money by keeping you sidelined. Unfortunately, these are not logged on this page.
We all know how fixed track records can be. It is hoped that counting movement in index price and seeing the time it took will give you a better undertanding if this trading method is suitable for you. Also, it is recommended that each trade, no matter what the option price, will always involve the same number of options. Therefore, as points are accumulated you can better estimate the return that this system achieves. However, DO NOT assume that accumulated points will yield $100.00 /point gross profit multiplied by the number of contracts traded. Option contracts fluctuate in price for numerous reason other than the corresponding change in index price.
Trades are logged in the order at which they are closed out-not in the order at which they are initiated.
* Full comentaries are kept 2 weeks, after which only the summary of the comment is available
** During adverse markets when limit moves bypass stop loss price points, the limit price( which is more punishing) will be used to calculate negative points
TRADE # 1
The comment in advance: Thursday, January 23rd 1997 @10PM - . The index closed at 762.20 and the Trailing Indicator issued a FULL SELL condition based on closing data . The analysis that evening was to go short on Friday at around 10:00AM until the OEX dropped to the 749 price point. From the very open, the index never rose above 763.98 on Friday. The OEX then declined to the 749 price point by mid morning the following Monday 1/27/97. Total trading hours to reach price objective was 8 hours.
Accumulated OEX index points : + 13.2
Subtotal of points YTD: +13.2
TRADE # 2
The comment in advance: Friday, January 24th 1997 @11:30PM-. The index closed at 754.60 and the TRAILING INDICATOR was maintaining a FULL SELL condition. The plan for Monday 1/27/97 was to go long when the OEX index hit the 749 price point. This was to happen immediately after short positions were exited from Trade #1 above. No stop loss was given. The 749 entry price point was reached mid morning on Monday 1/27. The price point to exit the trade was set at 760. On Tuesday at 9:55AM the OEX hit 760. 83. Total trading hours to reach price objective was 6 hours.
Accumulated OEX index points : + 11.0
Subtotal of points YTD: + 24.2
TRADE # 3
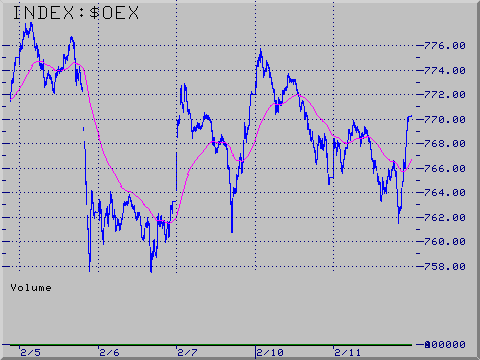
The comment in advance: Thurday, February 6th 1997 @ 9:00PM-. The index closed at 763.28 and the Trailing Indicator was maintaing a FULL SELL condition. The plan for Friday was to go short if the OEX index reach 770, and failed to stay above it on a restest. The price point to go short was a break below 768.50. The exit point (determined intraday after the trade was initiated) was 764. Entry occurred when the OEX broke below 768.50 at 12:45 pm. The 764 exit price point was reached at 2:25 pm that same day. Total trading hours to reach price objective was 1.7 hours. View 1 minute OEX chart

Accumulated OEX index points : +4.5
Average points per trade = 9.5 ......................Subtotal of points YTD: +28.7
TRADE # 4
The comment in advance: Monday, February 10, 1997- The OEX closed at 765.16 that day. The Trailing Indicator had returned to a Full Sell condition. The plan was to go short if after breaking 764, the OEX then went intraday below 761. This was the morning plan. It did not happen. During the morning the OEX only dipped to 763. Later in the day, the plan was revised to still go short on a break below 764 if the intraday low reached 762. A stop just 2 OEX points above the 762 price (= 764) was set in place just in case a reversal occurred. Shortly after 3:00pm eastern the index hit 761.50 satisfying my ammended commentary (but not the original plan). The index then reversed. Within 10 minutes the stop was hit and a small loss was recorded.

Accumulated OEX index points : -2.0
Average points per trade = 6.7........................Subtotal of points YTD: +26.7
TRADE # 5
The comment in advance: Wednesday, January 15, 1997 - The XAU index closed at 108.61. The recommendation was to go long if the XAU index closed above 109.50. The Prudent Trader did so on Thursday, January 16th, when the index was at 110.50. The recommendation also stated NOT to go short on a break below 107.83 because it would be a false breakout. THIS WAS AN ATYPICAL TRADE. The XAU then went into an 18 day trading range between 107 and 114.25 until on the 19th day the XAU hit an intraday low of 105.66 on February 12th and promptly reversed. By options expiration, the XAU hit an intraday high of 121.16 and closesd at 118.52. The Prudent Trader closed out his position at OEX 118.50 on Thursday, February 20th. for a 1/2 point loss on the trade. The time delay cut into the option premium so the battle was won but the war was lost-but only slightly. Depite recording +8.00 accumulated index points, the option actually lost 0.50 points in value. Therefore I will record the trade as a loss of 0.5 points so as not to misrepresent this trade.
Accumulated XAU index points :-0.50
Average points per trade=(-0.50)..........................Subtotal of points YTD: -0.50
TRADE # 6
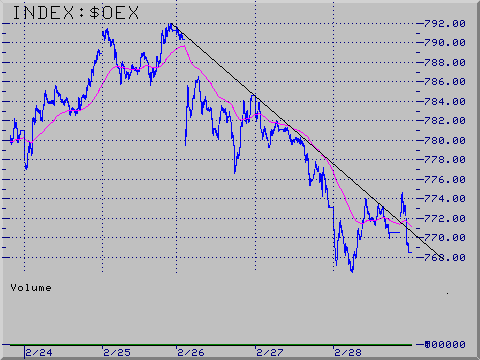
The comment in advance: Wednesday , February 26, 1997- The OEX index stood at 784.59. I had 2 plans to go short this index. Plan #1 did not materlialize fully. Plan #2 was to go short on another break below 776.50. Late in the day Thrursday, 2/27, the OEX broke below 776.50 to initiate the trade and the following morning, Friday 2/28, the index openned to the downside. The Prudent Trader's plan was to exit at OEX 771 but I ended up exiting at 767.50 because options trading did not start until the index had openned considerably lower. Although this trade represented a 9 point move in the index, the trade only yielded about $200/contract because of rapidly contracting premiums from the previous day. Everyone was expecting a sell-off late Thursday when the trade was initiated and everyone was trying to exit their put positions on Friday morning when the tick was at a -600.

Accumulated OEX Index points : +9.00
Average points per OEX trade = 7.1 ............................Subtotal of OEX points YTD = + 35.7
Trade #7
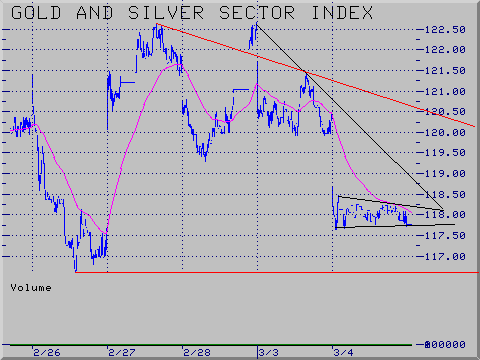
The comment in advance : Wednesday, February 26, 1997 - With the XAU Index sitting at 117.50 after having broken down, the plan was to go short on a retest of the 121 to 122 price zone. The next day, Thursday February 27th., the index spiked just above 122 and the Prudent Trader went short at the 122.40 price level. The position was held for just over 2 trading days and was exited mid morning on March 3rd when the XAU was at 117.93 .

Accumulate XAU Index points : +4.50
Average points per XAU Index trade = 2.00.............Subtotal of XAU index points YTD = 4.00