
Home
Yield Curve Analysis
Excel programming
Data Mining
Simulation techniques
Papers
Download
Links
About
Contact us ![]()


Last
updated:
April 21, 2000
Design & Content:
Csaba Horvath
| The historical evolution of the Hungarian zero coupon yield curve |
|
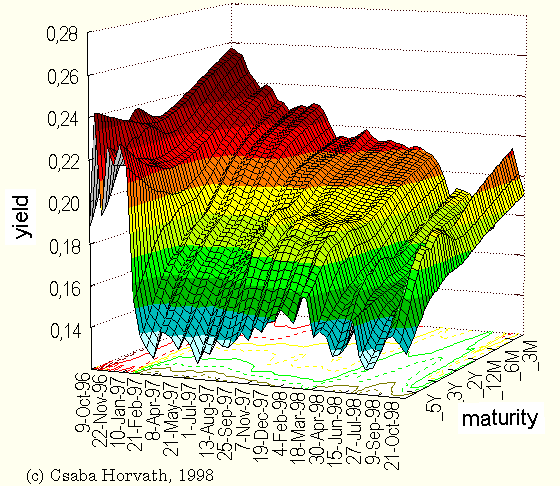
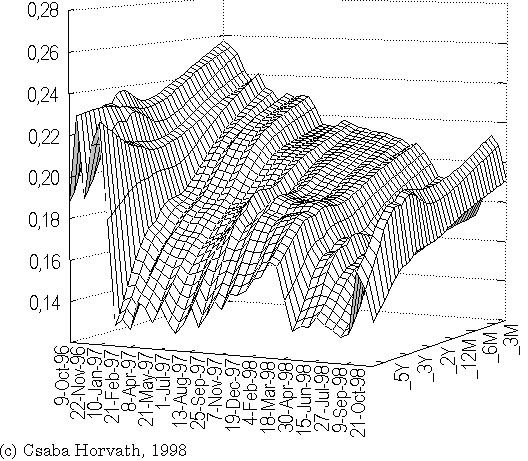
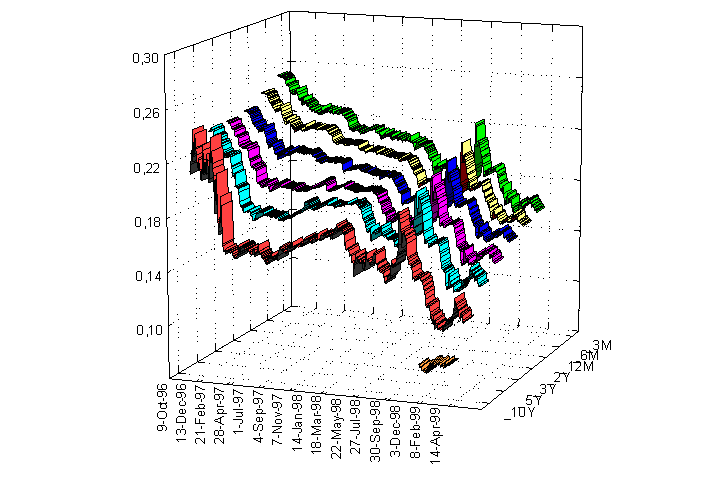
November 9, 1996 - April 28, 1999 Estimated by the ZCalc zero coupon yield curve estimation software. Svensson (extended Nelson-Siegel) method was used, based upon the REUTERS quotations (page HUBEST1..HUBEST3). Maturities are: 3, 6 months, 1,2,3,5 and 10 years (from right to left on the graph, that is the curve is downward-sloping due to a deflationary process). The longest T-note (and hence the estimated curve itself) has a maximum maturity of 5 years until January 19th, 1999 and up to 10 years from that time on. The longest T-bill has only a one-year maturity. Historical zero coupon yield curve, Hungary, 11-Nov-96 – 1-Dec-98
Historical zero coupon yield curve, Hungary, 11-Nov-96 – 28-Apr-99
|
Copyright © 1998-2000 Chaba Online (http://www.oocities.org/wallstreet/9403). All rights reserved.


