
Home
Yield Curve Analysis
Excel programming
Data Mining
Simulation techniques
Papers
Download
Links
About
Contact us ![]()


Last
updated:
April 21, 2000
Design & Content:
Csaba Horvath
| A visual approach to the concepts of the yield curve |
|
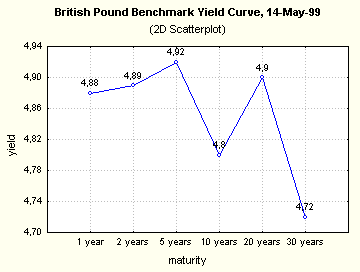
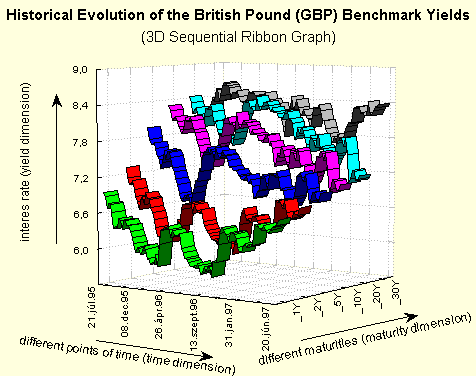
Still having difficulties imagine what is a 'yield curve'? Then these pictures are to help you. In the following I will guide you step-by-step to get familiar with these stunning graphs. STEP 1: a yield curve on a particular day STEP 2: yield curves of different days STEP 3: historical evolution of the yields of the benchmark maturities
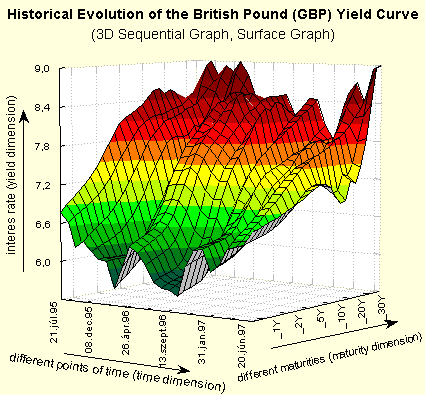
STEP 4: now all altogether in one three-dimensional graph: the
historical evolution of the yield curve of different maturities
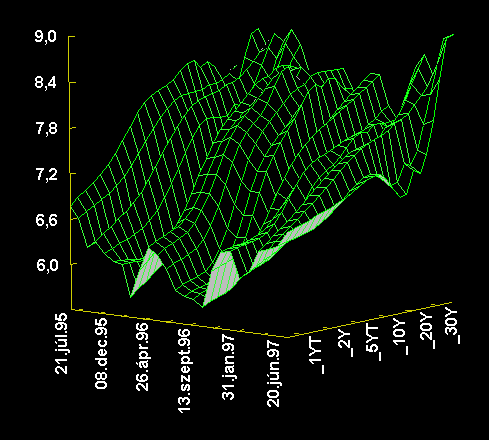
... and lastly the same graph as before, but without 'help': Cool, isn't it? Data used can be found here (in zipped
TAB-delimited text format). |
Copyright © 1998-2000 Chaba Online (http://www.oocities.org/wallstreet/9403). All rights reserved.


