Guest Commentary, by Clive Maund

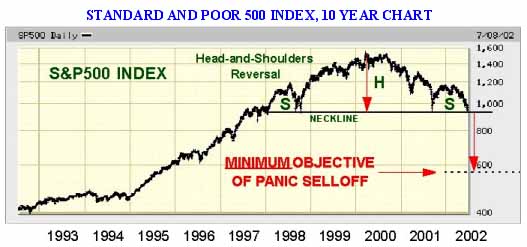
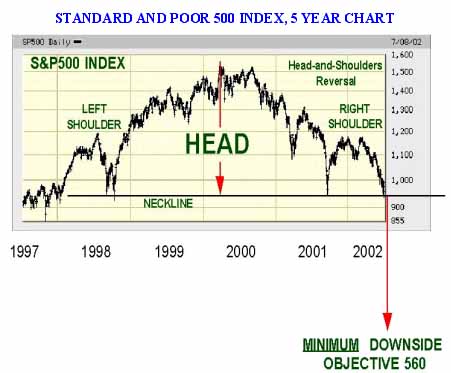
The great crash of 2002

July 11, 2002

Clive Maund is an English technical analyst, holding a diploma from the Society of Technical Analysts, Cambridge and living in southern Bavaria, Germany where he trades US markets.

There has been a lot of talk over the past year or two about "the bear market," how long it's run and the damage it's caused etc. Well, if you think what we've seen to date is a bear market, I've got news for you:- it's BEARly begun - you ain't seen nothin' yet!

Take a look at the long term 10-year S&P500 chart below and you will see that this index is just completing a massive 5-year long "Head-and-Shoulders" top. This is a large, clear formation which has major implications. The rule with these patterns is that the fall which follows a break of the neckline, shown as the almost horizontal line on the chart, will at least equal in extent the preceding decline from the absolute top to the neckline, as measured on a log. scale chart.

Many commentators have remarked that we have had no panic so far in this bear market, failing to grasp that the reason for this is that WE ARE STILL IN THE TOP AREA. By far the worst is yet to come.
I state now, without exaggeration, that I firmly believe that we are now about to witness, within the next few months, possibly within the next few weeks, the MOST DRAMATIC STOCK MARKET CRASH IN HISTORY, which will make the crash of '29 look like a Sunday School outing. THE WRITING IS ON THE WALL - it's as clear as that NASDAQ board in Times Square (and what a warning that was!). A clear break of the neckline of the Head-and-Shoulders formation on the S&P500 will probably, as often happens, be followed by a brief but deceptive pullback towards the neckline. After that a vertical all-out crash to the 560 area is to be expected. This will be a straight down vertical plunge - the market will go down like an elevator with its wire cut.

I am a pure technical analyst and my assessment of the outlook is an objective one based solely on the technical condition of the market. However, it often adds a bit of color to later learn the fundamental reasons for what transpires on the charts. A little bird has told me that THE MAJOR WALL ST. BROKERAGE HOUSES WILL SOON BE FACING A TIDAL WAVE OF LITIGATION from investors who are, among other things, apparently upset at collectively losing trillions when the NASDAQ bubble burst. A thing that seems to have really narked them is that while the big brokerage houses were issuing glowing recommendations on many of these stocks, they were at the same time circulating Emails and memos internally which were, to put it politely, less than complementary about the stocks they were recommending and openly mocked the "suckers" who bought them. This is not conjecture, this is a matter of public record - these mails were not shredded or deleted and exist as evidence. Damages are likely to be awarded in the billions, possibly reaching gargantuan proportions. As already discussed, the charts indicate that A TOTAL MELTDOWN IS IMMINENT. We've already had plenty of warning of what to expect from the Enron affair and then, much more seriously, the Worldcom scandal and these were just the tip of the iceberg. This mass litigation against the big Wall St. houses may well be the factor that precipitates the crash.

Some readers may consider me to be a doom and gloom merchant. Not at all. "Every cloud has a silver lining" is my motto, at least when it comes to markets - except that I now prefer to say "Every cloud has a GOLD lining!" If I am right in my assessment, then when the broad market caves in there will be a huge amount of money on the move and scurrying for safety - what better place for it to go, in the present climate, than into gold and highly leveraged (at this time positively, of course) gold stocks? I recently read that THE MARKET CAPITALISATION OF ALL GOLD STOCKS IS ONLY ABOUT $90 BILLION, OR ONE THIRD THE SIZE OF MICROSOFT!! If this is only approximately correct then it would require just a small percentage of that "funk money" panicking out the general stockmarket into gold and gold stocks to force massive rises in gold shares, where supply will quickly evaporate. "Smart Money" is already heavily entrenched in gold stocks, obvious to someone who is experienced in reading volume patterns on charts and they are using the current dip in gold shares to quietly soak up even more. When prices start rising again they won't be in a hurry to sell, supply of stock will therefore be suddenly very limited. A newly-arrived army of anxious buyers will find a market bereft of stock and I don't think I need to tell you what that means

Now, how does that song go? - ah, yes

Always look on the bright side of life, di-dum, di-dum di-dum di-dum 

The opinions expressed do not necessarily reflect those of David W. Tice & Associates, Inc. or the Prudent Bear Funds, Inc.