Kodak T-Max 100 (D-76) Development Chart
Testing Conditions:
| Hasselblad 501CM + CFi150/4 + A12 magazine | |
| Sekonic L-508 1o Spot meter | |
| Stainless Steel Tank processing, agitate continuously in the 1st minute and every 10 seconds (inverted 10 times) at 60 seconds interval | |
| Kodak D-76 Developer (1:1) at 20oC | |
| Kodak Indicator Stop Bath (1 min) | |
| Kodak Rapid Fixer (10 min) | |
| X-Rite Densitometer 311 |
Observation
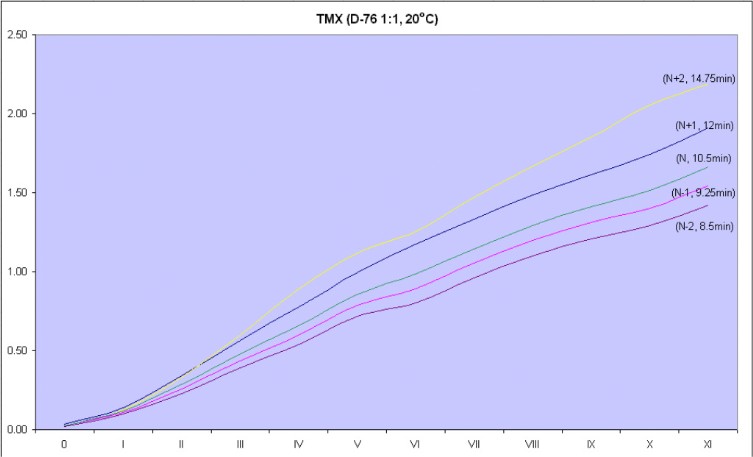
The 12 minutes development time is Kodak' recommendation but I find it to be N+1. The Zone I density also suggest the exposure index to be 80.
By looking at the characteristic curve, it has a more gentle shoulder region than the one developed by T-Max (1:4). Therefore, a better highlight latitude is expected.
Density Table (above Dmin+fog)
| Exposure Index | 64 | 64 | 64 | 80 | 80 |
| Development Time (min) | 8.5 | 9.25 | 10.5 | 12 | 14.75 |
| Development | N-2 | N-1 | N | N+1 | N+2 |
| Dmin | 0.08 | 0.08 | 0.09 | 0.10 | 0.10 |
| Zone | Density (above Dmin+fog) | ||||
| O | 0.02 | 0.02 | 0.03 | 0.03 | 0.03 |
| I | 0.10 | 0.11 | 0.12 | 0.14 | 0.12 |
| II | 0.23 | 0.26 | 0.29 | 0.34 | 0.33 |
| III | 0.39 | 0.43 | 0.48 | 0.57 | 0.60 |
| IV | 0.54 | 0.60 | 0.66 | 0.78 | 0.89 |
| V | 0.72 | 0.79 | 0.86 | 0.99 | 1.12 |
| VI | 0.80 | 0.89 | 0.99 | 1.17 | 1.25 |
| VII | 0.96 | 1.05 | 1.15 | 1.33 | 1.47 |
| VIII | 1.10 | 1.20 | 1.29 | 1.48 | 1.67 |
| IX | 1.21 | 1.31 | 1.41 | 1.61 | 1.85 |
| X | 1.29 | 1.40 | 1.52 | 1.74 | 2.06 |
| XI | 1.42 | 1.54 | 1.67 | 1.91 | 2.19 |
| Contrast (III-VIII) | 0.47 | 0.51 | 0.54 | 0.61 | 0.71 |
| Contrast (I-X) | 0.44 | 0.48 | 0.52 | 0.59 | 0.72 |
Comparison Chart