How to read your basic stock table as provided in your local newspaper or financial publications such as
the Wall Street Journal or Barons.
(image from StockUp)
This is the highest that the stock has sold for in the past year. For BEC, it means the stock price went as high as $32.25 in the past year. (32 1/4 = $32.25)
Similar to #1 except that this is the lowest that the stock has sold for in the past year. BEC sold as low as $26.25 in the past year. (26 1/4 = $26.25) By looking where the current price is in relation to the historical highs and lows, you can determine the present strength of a stock. A stock at or near its high is considered strong, and a stock at or near its low is considered weak.
This is the symbol that the stock goes by. Although IBM is a very familiar symbol, it really stands for International Business Machines. BNT in this example stands for Bentley Pharmaceuticals Inc.
Dividends are nothing more than capital paid to owners of the stocks. Capital in this case means money or more stock. For example, BEC paid $2.66 per share to all it's shareholders this year.
PE ratio means Price to Earnings ratio. PE is calculated by dividing the stock price by earnings per share for the last year. Earnings per share is calculated by taking the earnings the company made that year and dividing it by the number of shares the corporation has issued out. Generally, the lower the PE, the better, however, don't pick one stock over another just because it has a lower PE. Technically, the PE indicates how many years it will take to earn back the money you put into the share but it seldom turns out to be the case.
This indicates how many shares traded hands on this particular day in 100's. For example, BEC traded a total of 3,744,200 shares on this particular day. When there is an unusually high volume of trading on a particular stock, it means that shareholders are responding to some type of news or information that may affect the stock price.
This indicates the highest and the lowest that the stock traded for on this particular day. BEC for example traded as high as $38.25 and as low as $21.50 on this particular day. (Generally, the hi's and low's for a single day are not as volatile as they are in this example)
This is what the stock was trading for when the stock exchange closed for the trading day. The last trade made for BEC was for $38.
This is the net change in price from the previous market day close. BEC's stock price rose $1.50 today.
Now you know the basics of reading a stock table. Pick a stock to follow and each day note how the price of the stock changes. You should be able to understand what a 10% annual return looks like. For example, a stock will return 10% on your money if it's stock price goes up from say $10 to $11 in one year. If you had 1000 shares of this stock, you would make $1,000 that year. It's all very simple.
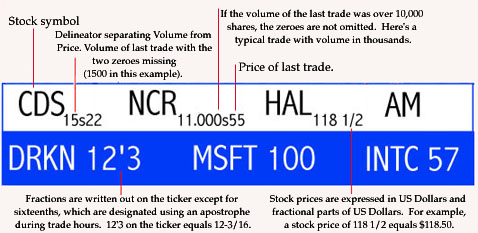
HOW TO READ A STOCK TICKER
CNBC Stock Ticker
There are two ticker tapes running on CNBC - before, during, and after market hours. The top ticker, in white represents the NYSE and is in real-time. The bottom ticker in blue, is the
AMEX and NASDAQ stocks -delayed 15 minutes.
AMEX symbols have four letters and NASDAQ trades on the bottom ticker use five letter symbols.
Before the market and opens and after it closes, you can see all the settlement prices for every stock in alphabetical order. During market hours, stock symbols are displayed as they are traded. About every minute the market summary will appear in the top ticker giving you market averages such as the DJIA, NASDAQ, etc.
Explaining The NumbersINTEL - INTC 120 1/2 = 100 shares of Intel traded at $120.50
10sINTC 120 1/2 = 1000 shares of Intel traded at $120.50
10.000INTC 120 1/2 = 10,000 shares of Intel traded at $120.50
Explanation of "Curbs In"
The words “Curbs In” appear in red above the Dow/S&P/Nasdaq displays when program trading curbs are in effect at the New York Stock Exchange.
That happens when the Dow Jones Industrial Average moves 50 points or more from the previous day’s close. The curbs remain in effect for the remainder of the day, unless the DJIA moves back within 25 points of the previous day’s close.
Program trading curbs are among the “circuit breakers” adopted by the NYSE and approved by the Securities and Exchange Commission in response to the big market decline in October, 1987. According to the NYSE, the curbs are designed to “reduce market volatility and promote investor confidence.” It says curbs were adopted “in response to concerns that index arbitrage (a form of program trading) may be aggravating large market-wide swings. The index arbitrage trading in this instance attempts to take advantage of price differences between stocks in the Standard and Poor’s 500 Stock Index and futures contracts based on those stocks.
When curbs are in place, index arbitrage orders for stocks in the S&P 500 are subject to what’s called a “tick test.” When the Dow is down, market sell orders may be executed only on a “plus or zero-plus tick.” A tick is the direction in which a stock’s price moved on its last sale. A “plus or zero-plus tick” means a stock’s price is higher than the trade just before, or at the same price as the trade just before but higher than the trade just before that. When the Dow is up, the opposite applies: buy orders may be executed only on a “minus or zero-minus tick.”
Program trading curbs were first adopted in 1988. At that time, a 50 point move in the Dow represented about 2.3 percent of the Index’s value, then about 2150.
Now that the Dow is trading above 8000, a 50-point move is a much smaller percentage and happens quite often. Curbs were imposed 303 times on 219 days in 1997.
The imposition of curbs does not affect orders placed by individual investors.
Ticker Symbols - A Little More
A ticker symbol is a unique set of characters assigned to a stock, mutual fund or other financial instrument for trading purposes.As you know stocks are traded on several exchanges, including the New York Stock Exchange, the American Stock Exchange, NASDAQ and in mutual funds.
The quote you see in your paper, online or scrolling on the bottom of your television screen includes pricing and information about the day's trading, this is the stock/ticker symbol.
Companys often go to great length to have their symbol be a unique one that reminds you of the company:
"T" - AT&T is for telephone
"WFR" - MEMC Electronics is for wafer
(they make silicon wafers)
"TOM" - Tommy HilfigerNYSE and AMEX
Stocks consist of one to three letters. Examples: ``T’’ - AT&T`, `BA’’ -Boeing Aircraft, ``AOL’’ -- America Online.
Preferred stocks add a period and a lowercase ``p’’ to the ticker symbol. Example: ``ANZ.p’’ -- Autralian and New Zealand Banking, preferred.
Class stocks append a period and the class code to the ticker symbol. Example: ``VIA.B’’ -- Viacom Inc. Class B
NASDAQ (National Association of Securities Dealers Automated Quotations)
Common stocks consist of four letters. ``MSFT’’ -- Microsoft Corp.; ``INTC" - Intel Corporation.
A fifth letter may be added to identify a stock that is not common or capital stock.
Mutual funds
Mutual fund ticker symbols consist of five letters, the last letter being an X. "JAMRX" - Janus Mercury Fund, "BEGRX" - Mutual Beacon Fund.