UNIT ONE: SECOND READING for MACRO
(Part 5 of 5) 
UNIT ONE: SECOND READING for MACRO
(Part 5 of 5)
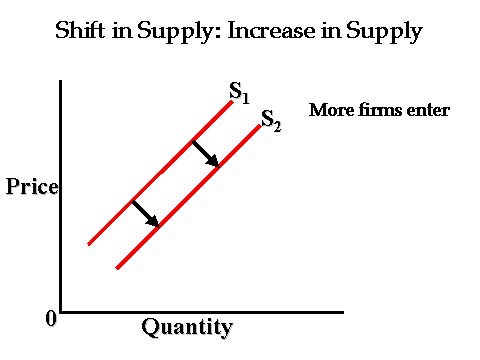
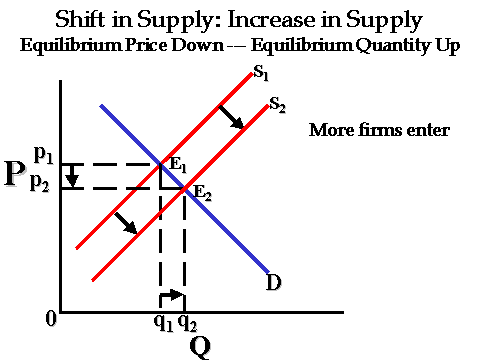
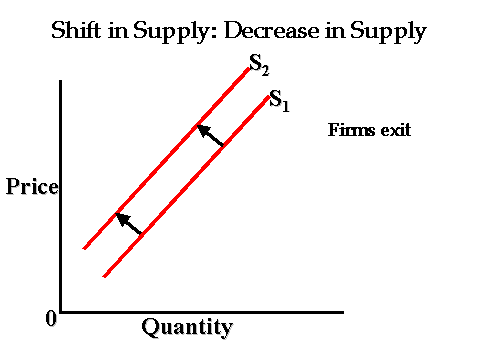
Now assume that as pizza became more popular, more firms entered the business. Clearly, the supply curve would shift rightward, an increase in supply, and there would be downward pressure on the price. It’s also true that the shift in demand to the right, an increase in demand, induced more firms to enter the industry. If consumer tastes changed and pizza became less popular as Mexican food became more popular, then some pizza firms would exit the business and the supply curve would shift to the left, a decrease in supply. At this point, there is upward pressure on the market price of pizza due to the restriction in supply. That sounds like a pleasant result for the industry, but the inducement for it was a change in consumer preference away from pizza. That is, a downward shift of the demand curve resulted in a supply curve to shift to the left. On a sketch graph, show the effect of more firms entering the industry. Then set up another sketch graph and show the effect of firms leaving the industry.
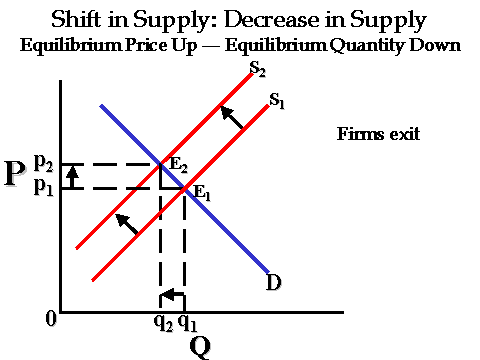
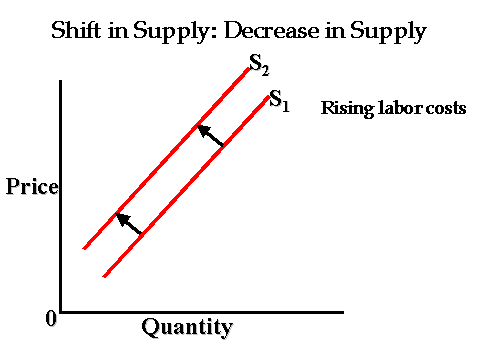
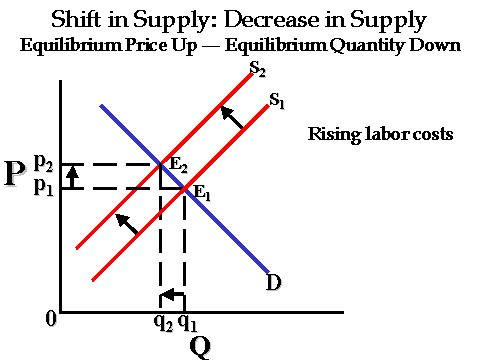
Assume that the government raises the minimum wage and this increases your labor cost. It increases the wage cost directly for any employees who may be earning the minimum wage and it increases your labor cost indirectly because an increase in the minimum wage will be followed by increase for non-minimum wage employees as well. At least, that is what has happened historically. When wage costs rise, the gap between total revenues and total costs shrinks. In other words, your profits decline. What do firms do when profits decrease? They reduce their output, a decrease in supply. The supply curve shifts back to the left. In the supply schedule above, the change may be from Q1 to Q3. A pizza restaurateur could try to counteract the rise in wage costs by substituting more machinery or automating, but there may be limits on how effective this can be, especially in the short-run. In the worst case scenario, an increase in a business firm’s costs could result in losses, and if not corrected, the firm may have to shut down. Set up a sketch graph and show the impact of rising labor costs.
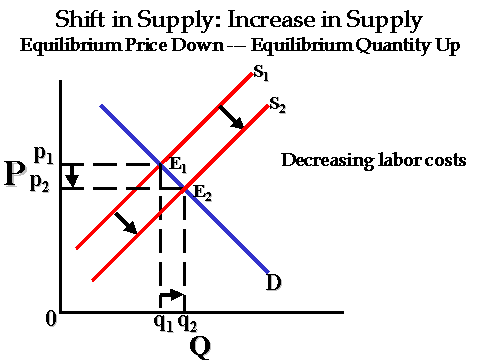
What if your labor cost went down? Now the gap between total revenues and total costs would increase and with more profit, you are in a position to increase your supply of pizza to the market. You might even be in a position to open a new outlet as you expand your business. The supply curve shifts to the right, an increase in supply.
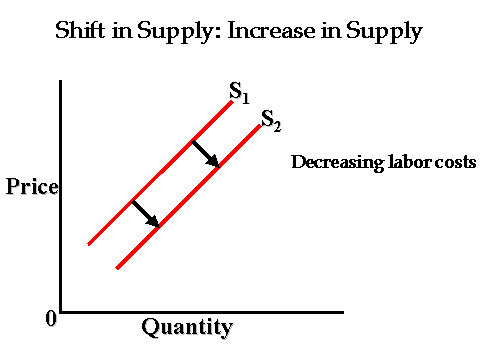
We have been discussing changes in labor cost, but the same principle holds true for changes in other factor (or resource) costs. An increase in the cost of capital goods such as equipment or machinery or an increase in the cost of land will result in a decrease in supply, a shift back to the left, while a decline in the cost of capital goods or the cost of land will lead to an increase in supply, a shift to the right.
Suppose that pizza became less desirable as consumers became more and more conscious of the high fat and sodium content. Instead of pizza, consumers substituted submarine sandwiches. The demand curve for subs shifts out to the right, an increase in demand, putting upward pressure on the price of subs. You could decide that it wouldn’t be all that difficult to cut back on your pizza business (or even exit it completely) and switch to supplying submarine sandwiches to the market. The pricing on subs attracts you to this business while the decline in pizza prices due to a demand shift to the left has made the pizza business less appealing. It is true that as you and other business firms switch to submarine sandwiches the supply curve will shift to the right, an increase in supply, and this will put some downward pressure on the price of subs. That is how our market system works.
Your author’s presentation of "The Marriage of Supply and Demand" begins on page 72. It is followed shortly thereafter by a discussion of "Equilibrium", which begins on page 74. After completing this section, please read the chapter summary on page 78. You are then ready to work on the Problems and Exercises for Unit One, Assignment Two.

