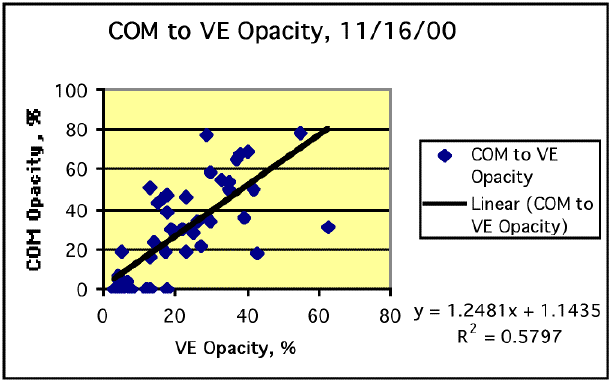
It can be observed that the data plots for the comparison of these signals does not appear as linear as the VE opacity comparison. Generally, the R2 values for the regressions are much higher for the logarithmic regressions than for the linear regressions. The variation of the comparisons is somewhat related to the variability of the COM data as compared with VE observations taken on a real time basis. Chart 1.3 shows a comparison of COM and VE data taken on November 16 during the surrogate particulate introduction periods. The regression of the data collected on November 15 during the set-up work indicated the same type of relationship. The correlation shows that the COM readings are generally higher than the VE observations.

Chart 1.3
Comparison of COM Opacity to VE Opacity during Surrogate Particulate Introduction, 11/16/00


Evaluation of the Regulatory Relationship of the COM and VE Opacity to the Triboelectric Signals

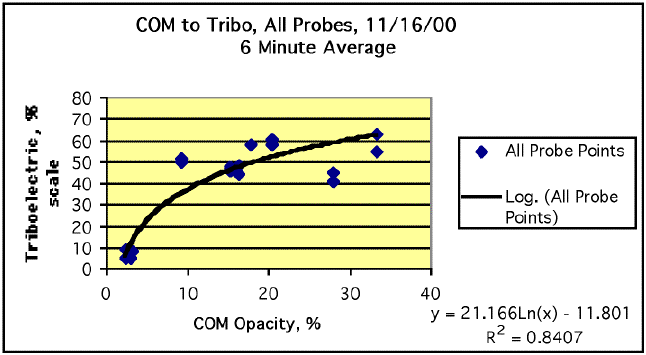
Compliance with the 3% opacity standard is based upon a six (6) minute average of opacities measured or observed during the 6 minute interval. Comparison of the COM and VE data to the Triboelectric signals, using a 6 minute average provides a different statistical population of points for comparison. The data averaged over 6 minutes for the respective instrument or method diminishes some of the swings measured on an instantaneous basis. Both the COM and the Triboelectric instruments make measurements on a frequency of two (2) times per second, and the VE measurements are made every fifteen (15) seconds. Using the measurements for all of the probe groups, averaged over 6 minutes, the Regression of Triboelectric signals to the COM signals produces the curve and formula presented in Chart 1.4. All of the points are based upon real time measurements.

Chart 1.4
Regression of 6 Minute Averaged COM and Triboelectric Measurements


The logarithmic regression of the data produces an equation with an R2 value exceeding 84%, indicating a very significant correlation.

On the other hand, the regression of VE Opacity to the Triboelectric signals produces a linear regression, similar to the ones previously identified for the individual probe groups compared to respective VE observations. The regression curve is presented in Chart 1.5.

Chart 1.5
Regression of 6 Minute Averaged VE Opacity and Triboelectric Measurements


The distribution of the data does not provide a basis for logarithmic regression, and the resulting linear regression function has an R2 value of 63%, indicating a significant correlation.

Given these comparison relationships, it appears that COM readings are logarithmic in relationship to the Triboelectric signals, while the VE opacity observations are linear in relationship to the Triboelectric signals.

These relationships can be better understood when the following observations are applied to the data:

- The relationship of Opacity (particulate) in air is a logarithmic relationship as established by the Beer-Lambert Law (light penetration in a fluid). As emissions increase, opacity can never exceed 100%.
- The Triboelectric system is more of a particle counter than a COM, and though both are measuring surrogate parameters for mass emissions, the particle counter is closer to a measurement of particles, and thereby a logarithmic relationship could be expected, based upon the Beer-Lambert Law.
- The relationship of opacity to triboelectric signals is more linear at opacities below 40%.
- The triboelectric system programming can be set to focus upon lower versus higher levels of particulate passing the probe. In the case of the EAF where basically the standard is no visual emissions (< 3% opacity), the triboelectric system focus is directed towards the low concentrations of particulate.
- The Method 9 reading of opacity at 15 second increments eliminates much of the variability incorporated in the COM measurements made every 0.5 seconds.
- The 5% band for visual opacity measurements also acts to dampen the logarithmic nature of the COM readings.

A review of the regression curves indicates several items with respect to the performance of the triboelectric signal measurements when compared to opacity, as measured by a COM or measured by VE observation. These are:

1. The slope of the linear regression curves for the respective plenum probes (A-1 to B-1 and A-2 to B-2) are very similar to each other. This indicates that the dust introduction into the respective plenums was generating a similar response from the respective probes, even though there was dilution associated with the increase air volume as the dust traveled down the plenum towards the stack.

2. The logarithmic and linear regression curves for the respective plenum probes, by location (A-1 to A-2 and B-1 to B-2), are very similar to each other respectively. The probe relationships are reflecting the relative location of the dust introduction point, which is up stream of the B probe groups. This similarity in signal response from one plenum to the other supports the reproducibility of the data and is representative for identifying the location of the particulate introduction point.

3. The logarithmic regression relationship of the COM data and the linear regression relationship of the VE data are indicative of the system’s performance being more linear in the lower opacity ranges. This would be expected for the EAF monitoring installation, since the manufacturer of the system configured it to better monitor in the range of relative opacities less than 40%.

4. The logarithmic correlation between the higher COM opacities and the triboelectric signals indicate that triboelectric signals, as a percent of scale, will be relatively insensitive to opacities above 40%. Stated another way, the triboelectric signals will vary proportionately to opacities below 40%, with the scale setting used by the manufacturer for this comparison test. The triboelectric scale percent of 70% to 100% will indicate increases and decreases in opacity, however the indication of the opacities between 40% and 100% will be contained within the 70% to 100% triboelectric signal range.

Recognizing that the low level COM readings were not absolute (moisture interference) during the test comparison period on November 16, but were relative to the increase or decrease in opacity, the comparisons between the COM and Triboelectric signals showed very good correlation, as well as reproducibility during this test period.

COM to Triboelectric Signal Comparison - Normal Operations

As noted previously, problems were repeatedly experienced with the COM during the 45 day comparison period. In spite of these problems, IPSCO determined to proceed with the comparison study using the original schedule period, recognizing that these problems are representative of the actual circumstances encountered by EAF operators who attempt to operate a COM on the stack of an EAF baghouse.

Given the erratic behavior of the COM (10/13/00 through 11/9/00), VE observations were made during all daylight periods when the COM was indicating a 6-minute average opacity of 3% or greater. This VE observation data indicates that there was only one actual period of 6 minutes with an average opacity > 3% (4.8% opacity). However, the COM showed extensive periods of opacity > 3% ( 9,300 minutes) during this period.

A review of the data indicates that the COM indicated false high opacities of > 3% for a total of six (6) days and portions of a day on three (3) other days, when there was no correlation of VE observations to support these readings. The majority of these false high readings occurred during the period between October 12 through October 18, and can be associated with the initial calibration done on September 25. The inflated readings ceased after October 18, when a recalibration and adjustment was done by a second technician. When surrogate particulate was introduced on November 1, 2000, it was found that the COM was completely insensitive to the particulate introduction at that time. It could be assumed that the 0% opacity readings, associated with insensitivity, began at or some time after the reprogramming done by the manufacturer’s representative on October 18. The fact that VE observations continued to indicate opacities < 3% throughout this period (10/18-11/1) provided a false sense of assurance that the COM inflation of opacities had been corrected. In fact, the COM was probably blind for most of this period. This fact remained undetected since the COM, if it were working correctly, would have recorded 0% opacities, the same as the VE observers during this same time period.

The COM was again recalibrated on November 6, 2000, and the unit continued to operate in a manner that better reflected actual emission characteristics throughout the period of 11/6 to 11/25. Some inflation of opacity was still a problem (moisture interference), however these period were less frequent, and corresponding VE observations identified the nonrepresentative opacities indicated during those periods of COM measurements > 3% opacity.

By comparison, the triboelectric signals were also tracked on a continuous basis. As a result of the surrogate particulate introduction tests, it was verified that the Triboelectric system tracks both visible and invisible particulate. Therefore, to evaluate the normal operations data, it is necessary to establish some signal levels with an assigned significance.

In IPSCO’s initial presentation of an operating and response system based upon use of the triboelectric broken bag detection system to USEPA, several signal ranges were proposed. Arbitrary levels were picked for illustration in the presentation, however for purposes of this comparison it was necessary to better quantify these ranges. The following signal ranges have been used for summarizing of the data tracked by the Triboelectric system. These ranges are for comparison purposes, and do not necessarily reflect the final ranges that will be implemented by IPSCO for operation of the baghouse and broken bag detection system. During the time period of 10/12/00 through 11/7/00 the scale factor for the triboelectric signals was set at 200 pico-amps. The percentages indicated are percent of scale, as displayed and recorded by the triboelectric system computer, and would typically apply to the scale factor of 200 pico-amps.

Normal Operating Range: 0% to 49%
Caution Range: 50% to 69%
Alarm Range: > 70%


For the A-1, B-1 probe groups during the time period of 10/12/00 through 11/7/00 there were several periods of signals that exceeded the Caution Range (50% to 69%) lasting a total of 43 minutes. The alarm range for the A-1, B-1 probe groups was exceeded for a total period of 6 minutes during this time period. By comparison the signals for the A-2, B-2 probe groups during the period of 10/12/00 through 11/7/00 had a total time of 1187 minutes above the Caution Range. The A-2, B-2 probe groups had no signals in the Alarm Range during this period.

There were no exceedances of the 3% opacity standard (as measured by Method 9) during this period, with the exception of one 6 minute period on 10/13/00. The projected triboelectric signal ranges at the 200 pA scale factor were indicative of the actual emission performance of the baghouse during this period.

The historic record of triboelectric signals is averaged for the purpose of plotting the historic data. On a real time basis, the system takes two (2) measurements per second, however the operator can select the averaging period that these measurements are plotted by the system. During the time period of October 12, 2000 through November 7, 2000, the data was tracked and plotted using a 6-minute average of the measurements at the scale factor of 200 pico-amps. At noon on November 8, 2000, the averaging period was reduced to a 1-minute average to allow for better comparisons to the VE observations and COM tracking done during the particulate introduction tests conducted on November 15 and 16. The scale factor was adjusted to 1500 pico-amps on November 8, to allow for better visual evaluation of the signals. The 1500 pico-amp scale factor reduced the normal signal activity to the bottom 1/3 of the operator’s visual screen display. This visual change in real time curve representation of the triboelectric signals increased the operators ability to identify abnormal spikes quickly. The 1-minute average and 1500 pico-amps scale factor were used for plotting the data for the period from November 8 through November 25. For the purposes of comparing the normal operating data, a different set of Normal, Caution and Alarm ranges needed to be established.

Given the linear regression analysis of the surrogate particulate comparison done on 11/16/00, these functions can provide a basis for calculating an approximate triboelectric signal that is equivalent to 3% opacity. Using a linear regression for the opacities below 40% provides a conservative margin for correlating the triboelectric signals to opacity, whether it is opacity measured by COM or VE observations. The linear regression curves for the respective probe points can be summarized as follows:

Probe B-2 y = 1.479x + 18.723
Probe A-2 y = 1.562 x + 14.806
Probe B-1 y = 1.0083 x + 31.33
Probe A-1 y = 0.71393 x + 31.735
Where: x = COM opacity, %
y = Triboelectric signal, % of scale


Using the four regression curves, the triboelectric signal ranges from 20% to 35% for all of the probe groups, as a percent of scale that is equivalent to 3% opacity. It is important to understand that the signal from the respective plenums groups, A-1, B-1 and A-2, B-2 are similar, but are different for the comparison period on November 16. This is to be expected since each plenum has a baseline triboelectric characteristic that is somewhat different because the respective baghouse compartments provide a slightly different baseline particulate load when the EAF is operating, as was the case on 11/16. This similarity with difference is evidenced by the linear regression formula. The opacity multiplier for the A-1, B-1 probes is approximately 1.0 while the multiplier for the A-2, B-2 is approximately 1.5. The constant for the A-1, B-1 probes is about 31 while the constant for the A-2, B-2 probes is about 16.

Given the slight difference in probe group readings with respect to COM opacity, the data collected after November 8, 2000 can be evaluated using the relationships established during the surrogate particulate comparison conducted on 11/16. Recognizing that the triboelectric signals include both visible and invisible particles, an alarm range equivalent to 3% opacity can be selected as indicated below for the respective probe groups, and is applicable when using the scale factor of 1500 pico-amps.

Therefore, these ranges are:

Probes Groups: A-1, B-1 A-2, B-2
Normal Operating Range: 0% to 29% 0% to 24%
Caution Range: 30% to 37% 25% to 29%
Alarm Range: > 38% > 30%


For the A-1, B-1 probe groups during the time period of 11/8/00 through 11/25/00 there were several periods of signals that exceeded the Caution Range (30% to 37%) lasting a total of 52 minutes. The alarm range for the A-1, B-1 probe groups was exceeded for a total period of 2 minutes during this time period. By comparison the signals for the A-2, B-2 probe groups during the period of 11/8/00 through 11/25/00 had a total time of 15 minutes above the Caution Range. The A-2, B-2 probe groups had no signals in the Alarm Range during this period.

When reviewing the data for the triboelectric signals it is evident that there was very little time when the triboelectric signals were in the alarm range. A total of two (2) minutes was tracked on November 22, when the triboelectric signals for the A-1, B-1 probes were above the Alarm level of 38%, and both VE observations and COM data indicated that opacity of the stack emission was below 3% for that operating day.

It can be determined from this comparison that the triboelectric signals are indicative of baghouse performance as well as indicative of compliance with a visual emission standard of 3% opacity. Further, the triboelectric signals allow the operator to identify the baghouse compartment zone that is contributing to increases in triboelectric signals, while the baghouse continues to operate in compliance with the opacity standard of 3%. Interface signal information from the baghouse PLC, which controls the row sequence of bag cleaning, will allow the operator to identify the contributing compartment as well as the row of bags contributing to the increase of particulate being discharge to the exhaust plenum. Given this information, the operator can make necessary corrective action long before the particulate contribution can contribute to a violation that lasts for 6 minutes.

No such advance information is available to the baghouse operator from the COM or VE observations of the stack exhaust plume. On the contrary, with the difficulty in maintaining a calibrated COM, the operator must always consider the condition of a false positive for greater than 3% opacity, and rule this out as the condition at hand before beginning any meaningful corrective action on the baghouse itself.

The triboelectric signals remained primarily within the normal range selected for this evaluation, with some periods when signals increased into the caution range, and one short period when the signal exceeded the alarm level. Given that the alarm range and the associated caution range were based upon the respective regression curve for the plenum probe group, it appears that the regression curve predicts the level of 3% opacity in a conservatively low manner, providing additional assurance that the 3% opacity would not be exceeded if the study triboelectric comparison ranges were actually used for operation of the baghouse.

It is also evident that the time duration of the triboelectric signals may be a factor in relating triboelectric signals to relative opacity. Since both the COM and the TribolinkTM comparison rely upon the size, quantity and structure of particles to make their measurements, the quantification of a time variable with respect to their relationship may not be significant. The triboelectric measurement includes particles that are invisible to a COM, and therefore will always have a signal duration factor related to this invisible portion of particulate. No study work was done to specifically quantify any time related variable between the triboelectric signal and COM opacity, however, using a relatively short averaging period for the triboelectric signal will mitigate the difference in the duration relationship associated with the invisible particles. The one minute averaging period used for the data tracked after November 8, provided a real time histographic curve that was indicative of the opacity measured by the COM and Method 9.

EAF Steel Production During Comparison
During the comparison period the EAF steel production continued in a normal fashion throughout the period. Beginning with October 12 through November 25 (45 day period), steel was melted on every day of the period. As is typical of steel melting operations, the number of heats processed on a given day varied. The reasons for the increase or decrease in production vary because of a number of factors, however it is important to assure that production occurred in a representative fashion during this comparison period. Daily EAF and LMF melting records were collected and reviewed for the entire period of the comparison test. From this review it can be concluded that the production of the Melt Shop was representative during the comparison test period.

Discussion of Findings and Conclusions
It is important to note that the data, correlations and formulae established for the IPSCO Steel Inc. - Montpelier Works baghouse are somewhat unique to the facility. The site specific nature of particulate generated by an EAF is unique to that particular furnace and its fume collection and control system. Many variables effect the size structure and quantity of particulate generated by a specific melt shop. These variables include: scrap type and charge practices, type of steels produced, length of heat cycle, slag practices, use of carbon and limestone, length of fume control duct, use of spark boxes, type of scrap preheating, type of off-gas cooling, etc. The combination of these variables makes the particulate being generated somewhat unique from shop to shop.

The general principles for the correlation and comparison of COM and VE opacity to Triboelectric signals are generally applicable to all EAF baghouses. Without having evaluated this relationship in other EAF operations, and until such data is generated, it is better to presume that the specific correlation formulae between opacity and triboelectric signals will vary from shop to shop.

The findings and conclusions of this study are as follows:

1. Both the COM and the TribolinkTM systems track increases and decreases in particulate emissions from the baghouse.

2. Both the COM and TribolinkTM systems are indicative of particulate present in the gas stream, although neither system is able to generate mass emissions rates or concentrations in this application.

3. The TribolinkTM system is able to detect changes in particulate levels that are invisible to the COM, and as such can provide the baghouse operator information on the deterioration of bags, long before the emissions become a violation of the Opacity standard.

4. The TribolinkTM system operated at the IPSCO Steel - Montpelier Works was configured by the manufacturer to focus on the lower opacity range of emissions, and this bias was observed during the surrogate particulate introduction periods. The TribolinkTM signals displayed a more linear relationship to COM opacity at opacity levels below 40%, and were linear to VE opacities observed during the comparison.

5. During the surrogate particulate comparison the TribolinkTM system response to opacities above 30% to 40% tends to be logarithmic in nature, and opacities as high as 80% or 100% would be tracked by the system as a percent of scale, with indicated levels still below 100% of scale. This does not appear to be a problem, since the standard for the EAF is a 6-minute average below 3%, and the system has a linear response characteristic with both the COM and VE opacity in this low range.

6. Using the linear regression curves generated during the surrogate particulate comparison on 11/16/00, the triboelectric signal level associated with 3% opacity was predicted to be 25% to 30% of the scale when the scale factor is set at 1500 pico-amps. Using the specific linear regression curves generated for the respective plenum groups, the data was evaluated against a range of signals that had an alarm range set at the predicted 3% opacity for the respective plenum group. VE and COM data collected during normal operations supported these levels as indicative of the actual opacity of emissions.

7. The comparison ranges of triboelectric signals used for evaluating the data from November 8 through November 25 showed that the TribolinkTM instrument was able to characterize the baghouse performance while still being indicative of compliance with the 3% opacity standard. The triboelectric signal was found above the alarm level for only two (2) minutes on November 22, during this period. The COM and VE observations on November 22 did not indicate any exceedances of the 3% opacity standard, and therefore it can be safely concluded that the regression curve predicts a 3% opacity that is conservatively low when compared to actual opacity, as measured by the either the COM or Method 9.

8. Since the TribolinkTM system probes were installed within specific zones of the discharge plenums of the baghouse, they served as a better indicator of the actual area performance for the baghouse compartments where the particulate increases were originating. The COM was unable to provide this type of area performance indication because of its location on the stack. The ability of the Auburn system to interface with the baghouse PLC further enhances the area identification capability of the TribolinkTM system. The Auburn computer/PLC interface can track the row and compartment of bags being pulse cleaned at any given time, and this information can be displayed with the alarm log data that indicates increases of particulate above the programmed caution or alarm levels. This identification feature significantly improves the operator’s ability to recognize and act upon problems long before they become visible opacity violations.

9. The TribolinkTM system generally allows the operator of the baghouse to be proactive in his response to the changes in bag filtering performance since the system is able to identify increases in particulate that are invisible to the COM and VE observers.

10. Even with repeated calibrations by the manufacturer, it was difficult to get good performance from the COM for opacities below 5% during this comparison study. By comparison, the TribolinkTM system operated throughout the comparison period without additional recalibration by the manufacturer.

11. It should be noted that the TribolinkTM system does have the ability to modem interface with the manufacturer’s home office, and this feature was installed on the Auburn system at Montpelier Works. This feature allows for trouble shooting assistance to be accessed by operators within a matter of minutes during normal business hours. A modem interface for the COM is not a feature available for that instrument.

It is clear that triboelectric signals can be correlated to opacity, and that particles of less than 1µ can be tracked by the system. Generally, the linear comparison function for triboelectric signals to opacity data is most directly applicable for opacities below 40%. This correlation range presents no problem for the EAF baghouse operations, which must comply with a 3% opacity standard. The TribolinkTM system provides a more precise and proactive tool for baghouse operators to maintain compliance with the no visible emission standard imposed by the 3% opacity level.

End of Document