THe Graph of an Cubic Equation

Sketching the Graph of an Cubic Equation

RowBox[{Sketch,  , the,  , graph,  , of,  , Cell[y = x^3<br />], Cell[<br />]}]

In[4]:=

Plot[x^3, {x, -6, 6}]

[Graphics:HTMLFiles/in_5.gif]

Out[4]=

⁃Graphics⁃

The slope of a cubic equation, as shown on below .

In[7]:=

Plot[10 * x^3, {x, -6, 6}]

[Graphics:HTMLFiles/in_9.gif]

Out[7]=

⁃Graphics⁃

In[8]:=

Plot[-10 * x^3, {x, -6, 6}]

[Graphics:HTMLFiles/in_12.gif]

Out[8]=

⁃Graphics⁃

In[9]:=

Plot[x^3 - 4x, {x, -4, 4}]

[Graphics:HTMLFiles/in_16.gif]

Out[9]=

⁃Graphics⁃

In[10]:=

Plot[x^3 - 4x - 6, {x, -4, 4}]

[Graphics:HTMLFiles/in_19.gif]

Out[10]=

⁃Graphics⁃

In[12]:=

Plot[(1/4) * x^3, {x, -4, 4}] 

[Graphics:HTMLFiles/in_24.gif]

Out[12]=

⁃Graphics⁃

In[14]:=

Plot[x^3 - x^2 - 3x + 2, {x, -4, 4}]

[Graphics:HTMLFiles/in_27.gif]

Out[14]=

⁃Graphics⁃

It is often easy to determine the solution points that have zero as either the x - coordinate  ... called intercepts because they are the points at which the graph intersects the x - or y - axis .

Finding Intercepts 1. To find x - intercepts, let y be zero and solve the equatoion for x . &# ... . To find y - intercepts, let x be zero and solve the equation for y .    

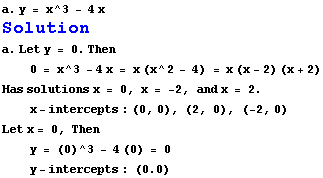
a . y = x^3 - 4x Solution a . Let y = 0. Then      0 = x^3 - 4x = x (x^2 - ... Then      y = (0)^3 - 4 (0) = 0     y - intercepts : (0.)

Let dy/dx = 0, then find (x, y).

y = x^3 - 4x

dy/dx = 3x^2 - 4

0 = 3x^2 - 4

x = - 1.06, x = 1.06 y = 3.05, x = -3.05

Use intercepts to grahp. Find the intercepts, then put the intercepts in the xy phase plane. connect all points.

point: (0, 0), (2, 0), (-2, 0), (1.06, -3.05), (-1.06, 3.05)

Find the intercepts and let dy/dx = 0, then find the (x, y). Grahp the equation.

1. y = x^3 - 5x^2 - x + 5

2. y = 27x^3 - 18x^2 -48x + 32

The solution

Notebook

To Interestgroup

Created by Mathematica  (April 20, 2004)