Back to the
Back to the |
|
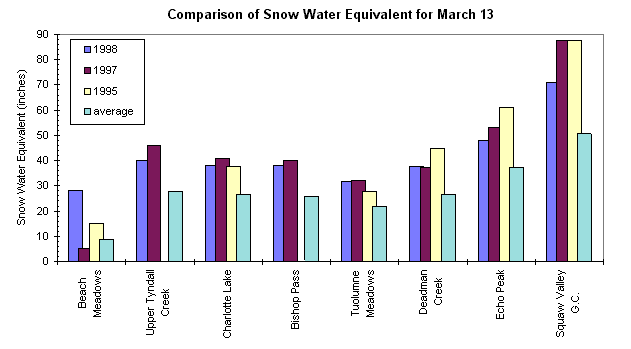
3-8-1998 The figure illustrates that snow levels are above normal compared to the historic averages for this date at each of the snow sensors (averages are calculated as the mean snow water equivalent for all years of record on this date). The figure also indicates that at the higher elevation stations, snow levels still lag behind both 1997 and 1995 - the last El Niño year. At lower elevation stations such as Beach Meadows and Tuolumne Meadows, this years snow levels are a bit higher than in 1997 or 1995.