Abstract
The discovery of RNA
molecules capable of catalysis significantly altered our understanding of
biological enzymes. These RNA enzymes,
or ribozymes, debased the notion that proteins are the only biomolecules
capable of multiple turnover enzymatic activity. Researchers found certain RNA introns were
able to fold and orient certain bases to form a catalytic core that promoted
self-slicing. This study examines the
thermal stability of those secondary and tertiary structural
elements of a ribozyme derived from the Anabaena Group I self-splicing pre-tRNAleu intron. We focus on the Anabaena
system in an effort to test the generality of conclusions drawn about Group I introns based on Tetrahymena. The primary structure of the intron has been known for some time
now, however the energetics of the structural
elements that support its catalytic ability have yet to be fully
characterized. Under a variety of
conditions, we monitored the concerted thermal unfolding of the ribozyme by
following the corresponding increase in ultraviolet absorbance. This increase in absorbance is based on the
theory of hyperchromicity, a phenomenon caused by the ability of p orbital dipole moments in conjugated base
ring systems to escape eachother’s electronic
environment as they become less constrained when a nucleic acid strand linearizes. This
produces a sigmoidal plot of absorbance versus
temperature known as a UV melting curve.
Approximating the denaturation to a phase
transition, we applied the van’t Hoff equation for
the enthalpy of temperature-dependent melting behavior to find enthalpy,
entropy, and free energy for the thermal transition. We tested constructs of the ribozyme with
mutations in the internal guide sequence (IGS) under varied magnesium and substrate
concentrations to explore the role of individual base residues in core
interactions stabilizing the critical site for substrate docking and
catalysis. A single point mutation in
either position 2 or 3 of the IGS produces a similar 2.3 kJ/mol decrease in
overall free energy change caused by adding magnesium. Mutating both doubles that loss of
stability. The introduction of substrate
causes a change in free energy corresponding to the number of possible base pairs
formed in docking however much greater in magnitude than the contribution would
be by the individual bonds.
Introduction
Catalysis
The maintenance of complex living systems is absolutely dependent on catalysis. The innumerable chemical reactions required to support life rarely occur spontaneously with adequate speed or specificity under physiological conditions. Biological catalysts known as enzymes support life in variety of ways. First, by transiently binding reactants in an optimal orientation, proximity, and microenvironment they lower the activation energy of reaction to raise the reaction rate by factors of 106 to 1012. Second, they work at temperatures below 100 °C, at atmospheric pressure, and near neutral pH which prevents damage to surrounding molecules not involved in the reaction. Third, enzymes are extremely specific with respect to their reactants, known as substrates, and rarely produce side products. Finally, enzymes are subject to a wide array of regulatory mechanisms ranging from complicated activation or inhibition cascades caused by other molecules, to simply limiting the amount of enzyme produced [Voet & Voet, 1995]. Catalytic molecules are a necessary consequence of the evolution of complex living chemical systems from simple organic molecules.
Enzymes attain their catalytic efficiency
though a well-defined three-dimensional structure. It is the shape of the active site and
spatial orientation of functional groups within it that gives an enzyme its
catalytic properties. Historically
proteins have been considered the exclusive biopolymer capable of catalysis [Branden & Tooze, 1991]. Their diverse array of amino acids ranging in
size, hydrophobicity, charge, and pKa optimize the ability
of proteins to perform catalytically using a conservative number of residues. However in the early 1980’s, Thomas Cech made the groundbreaking discovery that RNA molecules
were capable of catalysis [Cech et al.,
1981]. Cech
found a 413 base intron in the Tetrahymena
26S rRNA gene that was uniquely self-splicing.
Catalytic RNA
RNA
enzymes, or ribozymes, are capable of true multiple-turnover enzymatic
activity. By the virtue of a less
constrained phosphate backbone, RNAs can form complex well-defined secondary and
tertiary structures that are more like protein than its more famous
counterpart, DNA [Joyce, 2000]. Yet they
can create a fully functional catalytic mechanism from an assortment of only
four bases: adenine, cytosine, guanine, and uracil. Since the discovery of the Tetrahymena intron several other catalytic
RNAs have been discovered, all of which catalyze the cleavage and ligation of RNA though transesterification
or hydrolysis reactions [Brion, 1999; Tanner,
1996]. Still Tetrahymena, classified as a Group I intron, is the classic
model for catalytic RNA.
Group
I introns are widespread in nature, occurring in the nuclear, mitochondrial,
and chloroplast genomes of eukaryotes as well as eubacteria
and their phage. They have a conserved
secondary structure of 7 paired helical regions designated P1-P9, with P3, P4,
P6, and P7 forming the catalytic core and P1 containing the 5’ splice site
[Campbell & Cech, 1996; Cate
et al. 1996; Davies et al., 1992; Michel et al., 1982;
Tanner, 1997]. Helices P2-P9 are self-complimentary while P1 is formed by substrate
docking. P7 creates a pseudoknot, which
involves base-paring between one strand of an inner
loop with a distant single stranded region to create a tightly convoluted core,
common to many catalytic RNAs [Blackburn & Gait, 1996].
All
Group I introns carry out a two-step self-splicing transesterification
reaction that follows a standard acid-base catalytic mechanism [Cech et al., 1981, Zaug & Cech, 1982]. The first step is initiated by the 5’ exon folding back to dock with the intron and form the P1
domain. The base paring region is called
the internal guide sequence or IGS. Then
the 3’ hydroxyl group of exogenous guanosine bound
non-covalently near the 3’ splice site attacks the exon
phosphate as a nucleophile at the 5’ clevage site [Kuo & Cech, 1996; Strobel & Cech, 1995]. This clips the phosphate backbone leaving the
guanosine bound to the intron through a phosphodiester bond and the 5’ exon
with a free 3’ hydroxyl group. In the
second slower step the 5’ exon hydroxyl is brought
near the 3’ splice site though a yet to be understood conformational
change. In a similar way it clips the
intron free and leaves the exons ligated
together.
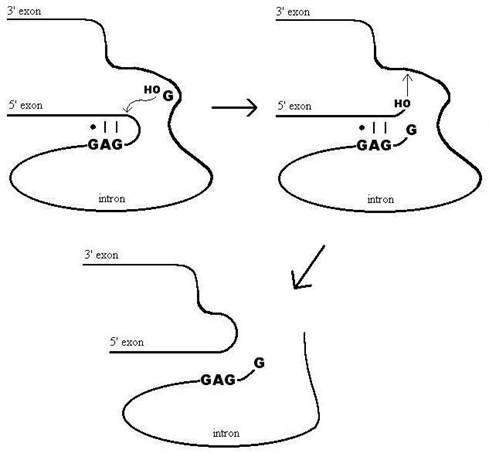
Figure 1. Group I intron self-splicing
mechanism.
The Anabaena Group I intron
This study focuses on the Anabaena PCC1720 Group I intron. Discovered in 1990 by Kuhsel et al. and Xu et al. in a pre-tRNAleu gene, it shares many structural and mechanistic characteristics with the classically studied Tetrahymena intron. We focus on the Anabaena system in an effort to test the generality of conclusions drawn about Group I introns based on Tetrahymena.
A number of unique differences make Anabaena itself a unique subject for study. The 247 base Anabaena intron is missing several peripheral elements known to significantly stabilize the 413 base Tetrahymena structure [Doudna & Szostak, 1989; Beaudry & Joyce, 1990]. Anabaena is also known to have a much shorter P1 helix, three bases long compared to six in Tetrahymena. Beaudry and Joyce have conducted experiments sequentially deleting structural elements to find the critical ones (1990). In the same way, the overall compactness of Anabaena compared to Tetrahymena will narrow our focus onto what structural elements are truly significant in Group I introns.
Despite Anabaena’s shorter and seemingly less stable docking site it exhibits reaction rates comparable to Tetrahymena [Zaug et al., 1993, Xu et al. 1990]. To carry out these kinetic studies the Anabaena intron has been converted to a multiple turnover ribozyme by Zaug et al. [1994]. By deleting the 5’ exon and the first 8 nucleotides of the intron, the 5’ splice site is eliminated, placing the IGS at the immediate 5’ terminus of the intron. This equips the ribozyme to cleave substrate specifically designed to bind with the IGS. Also, to aid in the transcription of the ribozymes a 16 base cap, denoted P0, was added to the 5’ end of the intron to provide a constant sequence for transcription primers to anneal to.
Figure 2. Wild-type Anabaena ribozyme secondary structure
bound to substrate. Substrate is shown larger in black. Core domains are in blue. The nucleophilic
exogenous guanosine is shown bound near the 3’
terminus.
Substrate specificity for a ribozyme like Anabaena with such a short substrate-binding domain presents an interesting problem. Given a random assortment of 4 bases in any RNA molecule, the complement to Anabaena’s specific 3 base IGS sequence is going to occur randomly every 64 bases. It has been appropriately proposed that substrate specificity in Anabaena must be installed by something other than base-pairing in the IGS [Doudna et al., 1989]. Previous kinetic studies involving mutation of the IGS gave highly unpredictable results [Davilla-Aponte, 1993]. Conversion of the wild-type IGS, 5’-GAG-3’ (substrate 3’-UUC-5’), to GGG and the substrate to UCC resulted in a 10-fold increase in reaction rate. Converting the IGS to GAC and the substrate to UUG caused a 10-fold reduction. This is despite the fact that the each of these constructs conserves two Watson-Crick base pairs and one wobble-pair as in the wild-type. Interactions beyond those involved in the P1 secondary structure must play a major role in the Anabaena catalytic mechanism.
Structural Stability
Catalytic ability appears to be significantly influenced by longer range intramolecular interactions between secondary structural regions. This creates tertiary structural elements that are important for the precise coordination of reactive groups at the catalytic site [Banjeree, 1993]. Understanding the molecular basis of the specific reaction mechanism requires knowing the three-dimensional structures of molecules involved. Following these kinetic studies, it is of great interest to examine the structure behind the mechanism.
The problem of folding is probably more complex in RNA than any other biomolecule. The large size of most RNA molecules makes their unraveling by molecular biology methods prohibitively slow. Physical methods of structure elucidation are inhibited by the asymmetrical nature of most RNAs and their reluctance to crystallize. Even if we could skip ahead to these methods, the first step in any structure determination is free energy minimization [Tinoco et al. 1971, 1973; Turner et al., 1988; Zuker, 1989; Jager et al., 1989]. Thermodynamic data for RNA is limited though. Nearest neighbor interactions seem to play the most significant role in secondary structure stability yet they have only been modeled in short hairpins [Tinoco et al. 1971, 1973; Frier et al., 1986; Turner et al., 1988]. The significance of a base pair’s nearest-neighbor was first demonstrated empirically by Turner in 1988 in a series of melting experiments on short hairpins. Turner showed that the stability of a base pair was affected by what sort of other pairs it surrounded by. These have been worked into a computer algorithm by Matthews and developed into the software named RNAstructure. It is a useful piece of software that sums the thermodynamic contribution of each base-pair in an entered sequence [Matthews et al., 1999]. Obviously the method is severely limited for larger RNAs. It considers only the direct hydrogen bonding as well as nearest-neighbor interactions ignoring tertiary interactions as well as the binding of any divalent cations. It also cannot model pseudoknots. We used it to model Anabaena however the reported free energy was extremely low given the omitted structural features and we disregarded the results.
Thermal Denaturation
The thermodynamic parameters that govern the concerted folding of an entire large biomolecule can be empirically determined by treating its thermal denaturation as a phase transition (i.e melting), and monitoring its progress over a range of temperatures. The order-disorder transition can be easily followed by ultraviolet absorbance over a range of temperatures [Puglisi, 1989; Breslauer, 1987]. As regions of stacked base pairs are disrupted they absorb better due to a phenomenon known as hyperchromicity. UV absorbance by RNA is caused by p to p* transitions in the conjugated ring systems of the nucleotide bases. The transition is facilitated by delocalization of the p electron cloud though electron withdrawing or donating groups unique to each purine or pyrimidine ring system. The unique arrangement of substituents imparts a molecular dipole. When RNA is in a folded state these planar bases are constrained in a stacked confirmation and they invade each other’s electronic environment. Here the dipoles counteract and interfere with electron delocalization. When thermal denaturation bases can escape each others’ electronic environment and the p electron clouds feel the full force of the local substituents. This increases the likelihood for a p to p* transition and is registered as an increase in UV light. Thus by monitoring a sample’s absorbance of UV light one can follow its concerted thermal denaturation and refolding. This is the basis for thermal melt UV spectroscopy.

Figure 3. Theory of hyperchromicity. Unique substituents of varying
electron withdrawing or donating ability give unique electronic dipole moments
to the four bases in nucleic acids. When
a nucleic acid strand adopts a folded state and these bases are stacked and
constrained, the dipoles counteract each other.
However if a strand is denatured, the bases can escape
each other’s electronic environment and exhibit stronger electron
delocalization. This lowers the
energy required for a pi to pi* electronic transition resulting in increased UV
absorbance called hyperchromicity.
Calculation of thermodynamic parameters
The extraction of thermodynamic data from UV melt curves can be done two ways. The first is the derivative method. It can only be used to find the melting point of the molecule under analysis, however this simple parameter is a reasonable indicator of stability. This method defines the melting point as the temperature Tm where the most molecules denature given constant heating. The Tm can be found by plotting the first derivative of absorbance with respect to temperature. The first derivative plot peaks at the raw absorbance inflection point marking the Tm. Figure 4 is an example of raw absorbance data and first derivative indicating the Tm.
Tm![]()
Figure 4. Example of a thermal melting curve and
first derivative.
The second method of analysis is more mathematical and can be used to calculate Tm as well as DH, DS, and DG parameters. It is based on the van’t Hoff equation for transition dependent enthalpy [Atkins, 1998; Puglisi, 1989; Breslauer, 1987]
![]() (1)
(1)
If we model the temperature dependent transition between native and denatured states
![]() (2)
(2)
![]() (3)
(3)
![]() (4)
(4)
If we define the melting temperature Tm as the point where half of the molecules are in each state a = 0.5, we can obtain a general expression for transition enthalpy at the Tm in terms of experimentally assessable parameters by substituting Eq. 4 into Eq.1
 (6)
(6)
a y
![]()


c b slope = -DH/R a = x/(x+y)


Figure 5. Example of absorbance, a, and van’t Hoff plots. a) Raw absorbance data versus temperature (thermal melting curve) was first smoothed mathematically by averaging across 5 data points. Baselines were then defined in WinUV software by manually defining regions for a linear least squares fit. Then if x is the distance to the upper baseline and y the distance to the lower, the fraction of native molecules remaining a is defined, a=x/(x+y). b) Alpha plot. The slope of the linear region, defined da/dT is used to find the equilibrium constant, K, using the van’t Hoff equation for temperature dependent transition enthalpy. c) Rearranging the van’ Hoff equation into the form y=mx+b defines a plot of 1000/T versus ln (K) where slope = -DH/R and intercept = DS/R, where R is the gas constant. From these values free energy of transition, DG, can be calculated.
and differentiating a with respect to T while solving for DHVH at the Tm (where a = 0.5)
![]() (7)
(7)
which gives the
coefficient of the final expression
![]() (8)
(8)
Rearranging Eq.
4 into the format y
= mx+b, which yields a useful plot of
1000/T versus ln K
known as a van’t Hoff plot. Upon inspection one can see that the negative
slope of the van’t Hoff plot equals transition enthalpy divided by the gas
constant. At the intercept ln K = 0 and K = 1, therefore DG = 0 at this
point, which equals the transition entropy divided by the gas constant. Finally free energy can be found from the
standard formula
![]() (9)
(9)
Overview of experimentation
We chose to examine the wild-type Anabaena ribozyme and three constructs with mutations in the IGS. One has a point mutation in position 2, one has a mutation at position 3, and one is mutated at both positions. We assayed their structural stability with and without the presence of magnesium to determine the role of these bases in binding divalent cations, known to stabilize catalytic RNA cores [Bassi, 1997]. We also introduced substrate to see if the complement of the P1 helix significantly stabilized the overall structure.
Materials & Methods
PCR preparation of DNA template
A DNA template for transcription was prepared by PCR with
reagents from the PCR MasterTaq™ Kit and dNTP set (Eppendorf)
and a Mastercycler™ gradient thermocycler
(Eppindorf).
All reagents and equipment are licensed from F. Hoffmann-La Roche Ltd., Roche
Molecular Systems, Inc., and The Perkin-Elmer Corporation. L8 Hammerhead plasmid was used as a template
in each reaction and the various constructs were generated though the amplification
of unique 5’ primers that encoded the ribozymes. Separate 100 ml
reactions assembled in 0.2 mL thin-walled PCR tubes (Eppendorf)
on ice contained 37 ml sterile deionized water, 20 ml TaqMaster™ PCR enhancer, 10 ml reaction buffer (500 mM KCl, 100 mM Tris-HCl pH 8.3 at 25°C, 15 mM MgCl2, 1% Triton® X 100), 2 ml each dNTP,
10 ml template, 10 ml 5’ primer, 10 ml 3’ primer, and 1 ml Taq
DNA polymerase. The thermal cycle was 95 °C for 1 minute, 55 °C for 1 minute, 72 °C for 1.5 minutes, repeated 30 times.
A sample of each PCR product was checked for completeness and/or
contamination on a 3% high-resolution agarose gel (BioWhittaker)
run with a pBR322 DNA Msp I digest size
marker (New England Biolabs) and ethidium. Samples were quantified on a Lambda 12 UV-Vis Spectrophotometer (Perkin-Elmer) by taking the A260 and approximating 50 mg/ml per absorbance
unit. Molarities were based on an
approximated molecular weight of 84,553 u (average 329 u per nucloside, 257 nucleosides per molecule). DNA samples were
stored at 4 °C.
Transcription of ribozyme
constructs
RNA was transcribed in vitro using reagents from either the MEGAshortscript™
High Yield Transcription Kit (Ambion) or the AmpliScribe™
T7 High Yield Transcription Kit (Eppicentre). The full protocol for each is
available online in the personal document format (.pdf)
at each company’s website. Each 20 ml Ambion transcription reaction
assembled in a 0.5 ml tube at room temperature contained 6 ml Rnase-free
water, 2 ml proprietary reaction
buffer, 2 ml each dNTP,
2 ml PCR DNA template, 2 ml T7 enzyme mix, and was
incubated at 37°C for 2 hours. Each 20 ml Eppicentre transcription
reaction assembled in a 0.5 ml tube at room temperature contained 8 ml Rnase-free
water, 2 ml proprietary reaction
buffer, 1.5 ml each dNTP, 2 ml DTT, 2 ml T7 enzyme solution, and was incubated at
37 °C for 6 hours. Both reaction methods were stopped by the
addition of 20 ml of formamide gel loading buffer and storage
at –20 °C until ready for gel
purification. Reactions were purified
and checked for complete RNA products by preparative PAGE and UV shadow
imaging. Several reactions were often
run on a single gel however a separate gel was always used for each type of
construct being purified. Gels contained
8% polyacrylamide, 7% urea, 1X
TBE and ran at 450V, constant current, for 1 hour, then transferred to
cellophane. Bands were resolved as
shadows on a UV reflecting screen (Kodak) illuminated by a hand-held 254 nm
lamp. Gel bands containing the RNA
product were carefully excised with a sterile razor blade, chopped finely,
weighed, and flash-frozen in powdered dry ice.
The expanding ice in the freezing gel disrupts the gel matrix to
facilitate elution. Then 3 ml of TEN
elution buffer was added per gram of gel and stored at 4 °C overnight with gentle
rocking. Next gel particles were removed
by syringe filtration though a 0.22 mm membrane.
Precipitation of the RNA was initiated by the addition of 3 volumes
ice-cold 100% ethanol and 0.1 volumes of 5M NaCl and
storage at –20 °C overnight. Centrifugation at
27,000 X G for 30 minutes collected the RNA pellet that was then transferred to
a 1 ml tube and desalted with 2 washes of ice-cold 70% ethanol. The pellet of purified RNA was dried at room
temperature and resuspended in 100 ml per reaction of RNase-free water. Samples were quantified on a Lambda 12 UV-Vis Spectrophotometer (Perkin-Elmer) by taking the A260 and approximating 40 mg/ml per absorbance
unit. Molarities were based on an
approximated molecular weight of 84,553 u (average 329 u per nucloside, 257 nucleosides per molecule). RNA samples were stored at -20°C.
UV thermal melts
Thermal melts were run on a Cary300
high-performance UV-Vis spectrophotometer (Varian),
equipped with a 6x6 multicell holder, temperature
probe accessory, and peltier thermal
control unit, controlled by the WinUV software (Varian) running
under the Windows 98 operating system (Microsoft). Each 0.9 ml sample was prepared at room
temperature in a 1.5 ml tube and then transferred to one of two matched 1 ml
quartz curvettes (Cary
Using the standard melt protocol to gather data for a construct in magnesium-free buffer, in the presence of substrate, and then with substrate and magnesium takes approximately 11 hours 30 minutes. Once ample data were collected for each construct in the magnesium-free buffer and in the presence of magnesium without substrate, having to run the entire standard protocol just to get magnesium+substrate data severely limited throughput. A speed protocol was tested that involved simply preparing the sample with RNA, substrate, and magnesium and immediately ramping it only once from 20-90 °C at 5 °C min-1. Data from the 14 minute single-ramp speed protocol were carefully analyzed and compared directly to the final ramp of the 11.5 hour standard protocol.
Data handling
Within the WinUV
software, data sets were smoothed over a 5 data point interval. For the derivative method of determining Tm the first derivative was taken based on a
15 data point window. The van’t Hoff
method of calculating thermodynamic parameters first involved constructing an a plot by converting the
temperature versus absorbance data to an expression of the fraction of
denatured molecules remaining as a function of temperature. This is done in the WinUV
software package by marking the linear regions where RNA is completely
associated and then where it is completely disassociated. The software then calculates a linear
least-squares fit baseline extrapolated to both ends of the plot. If x is the distance to the upper line an y the distance to the lower
line, the fraction of denatured strands at that point can be expressed as a where, a
= x/(x+y). From the slope of the linear region in the a plot the software
generates a van’t Hoff plot and reports thermodynamic parameters based on
equations previously outlined.
Sample Preparation
PCR
reactions created an abundance of extremely pure DNA template. Agarose gel electrophoresis of the product
run along side a size marker confirmed its proper length of 257 bases with no detectable
amount of incomplete or oversize fragments as seen in Figure 6. UV quantification approximating 50 mg/ml per A260 unit gave a yield of 7.5 mg per 100 ml reaction. Since approximately 150 ng
of template is required to optimize a 20 ml transcription reaction, this amount could
be conveniently delivered in a 2 ml volume.
Transcription reactions worked well off the PCR template. After 2 hours most produced their maximum
theoretical yield of 100 mg. They were also quantified by
UV spectroscopy approximating 40 mg/ml per absorbance unit. Dilution of each transcription with 100ml Rnase-free
water gave us 8 mM stock samples.
76 – 67 – 110 – 123 – 147+147 – 160+160 – 217 – 242+238 – 303 – 404 – 527 – – 257 201 – 190 – 180 – 90 – 622 –


Figure 6. Agarose Gel Electrophoresis of wild-type PCR
product. Left lane: 1ml (1mg/ml) pBR322 DNA Msp I digest size marker. Right lane, 1 ml
wild-type PCR product.
Thermal melt protocols
Early in the development of our
first protocol for thermal melts we routinely obtained extremely
non-reproducible and jagged plots despite careful laboratory technique. Troubleshooting melts done with simple tRNAs exhibited extremely
well-defined transitions under identical conditions. At first it appeared that the resolution of
the Cary300 was too low to manage the unfolding of such a complicated molecule. However, experimentation with extremely slow
ramp rates and additional repetitive ramps began to produce acceptable data and
eventually became as the standard protocol.
We suspected that problems in our early data were most likely due to a
non-homogeneous sample population locked in a wide range of several folding
energy local minima [Chen & Dill, 2000].
However, later results from the speed protocol contradicted this theory. Qualitatively, plots of runs carried out under the speed protocol were more rough then those gathered under the standard protocol. However after the smoothing function was applied over both, plots from the 14 minute protocol were virtually indistinguishable from the 11.5 hour protocol. Figure 7 shows wild-type thermodynamic parameters derived from van’t Hoff analysis of the final ramp in a full standard protocol compared to a single quick ramp done under the speed protocol. We often saw greater differences between runs done under identical conditions. Variations between the standard and speed protocols are well within the range of experimental error for the technique. It appears that multiple ramps and ramp speeds slower than 5 °C min-1 are not necessary. These results should be of considerable value to future researchers.

Figure 7. Comparison of standard and speed protocols. 160 nM WT+ 0.5 mM
Mg2++ 160 nM substrate. Full standard protocol consisted of two 5 °C min-1 runs between 20-90 °C and four 1 °C min-1
runs at the same temperatures in magnesium-free buffer with 3 a three minute
hold after each run (5.5 hours), then repeating in the presence of substrate
(11 hours), then adding magnesium and ramping between 20-55 °C at 5 °C min-1
and finally from 20-90 °C at 5 °C min-1 (11.5 hours). Thermodynamic parameters calculated from this
last run are shown. The speed protocol
involved preparing the sample with RNA, substrate, and magnesium at once and
running a single 20-90 °C ramp at 5 °C min-1 (@ 14
minutes). Thermodynamic data from this
14 minute method does not vary appreciably from the 11.5 hour method.
Concentration
dependence
To be sure that the transitions that we were observing were not due to a bimolecular aggregation and disassociation reaction we conducted pilot runs with concentrations of RNA varying from approximately 50 to 200 nM (A260: 0.1 to 0.4). [Puglisi, 1989; Breslauer, 1987]. We found no effect. The simple expression of K as the ratio of folded to denatured strands (Eq. 3), rewritten as a function of a requires a total-concentration term (Eq. 4). This term disappears when n = 1 as in our case of approximating the concerted folding as a single self-complementary strand. However one can see in the formula that should a bimolecular reaction be present, a, as well as all thermodynamic parameters calculated by van’t Hoff analysis will change with the concentration of RNA.
Derivative analysis
The derivative method of analysis
suggests that adding an effective concentration of 0.5 mM
Mg2+ has a uniform effect on all of the mutant
and wild-type constructs. It suggests a
13 °C increase in Tm for each construct as
shown in Figure 7. These results do not
follow results from the more robust van’t Hoff method leaving us skeptical of
their accuracy. Substrate data were not
analyzed by the derivative method for this reason.
Derivative analysis did however
expose an interesting feature in certain runs of the WT and M2 constructs. A shoulder in the derivative data at 35 °C exposed a possible low
temperature transition. It most likely
corresponds to the formation of tertiary structural elements however its
difficulty to reproduce prohibited quantitative analysis.
van’t Hoff analysis – magnesium binding
Analysis
by the van’t Hoff method suggests that both the second and third nucleotides in
the IGS are equally involved in magnesium binding for structural
stability. Values for transition
enthalpy and entropy logically follow the Tm, and once combined to give free energy at
biological temperature (37 °C) they
yield highly predicable results. As
represented in Figure 8, the addition of 0.5 mM Mg2+
stabilized the WT construct by 10.9 kJ/mol. This is the difference in free energies of
the thermal transition in magnesium free buffer versus 0.5 mM
Mg2+. The position 2 mutant
and the position 3 mutant were only 8.6 and 8.7 kJ/mol more stable in the
presence of magnesium, approximately 2.4 kJ/mol less than the wild-type. The construct mutated at both positions 2 and
3 showed the additive effects of single mutations. Its free energy in the presence of magnesium
was only 5.4 kJ/mol more stable with Mg2+ than
without. These results clearly
support previous studies illustrating the importance of divalent cation binding in the catalytic core of Group I introns.


DTm = 13.3 DTm = 13.1 DTm = 13.3
DTm = 13.1
Figure 8. Derivative plots of all
constructs with and without magnesium and corresponding Tm shifts. dA/dT
for ribozymes measured at 260 nm at a heating rate of
1°C min-1. Samples were run once in melting buffer (250 mM sodium cacodylate, 0.5 mM EDTA) then 1.0 mM MgCl2
was added for an effective Mg2+ concentration of 0.5 mM and re-run. The first
derivative of absorbance versus temperature plot displays a peak at the
inflection point in the raw absorbance plot where equal concentration
of folded and denatured RNA exist.
This temperature is the Tm. By this analysis method,
mutations to the IGS to not appear to significantly affect to the overall
stability of the secondary structure.
c d b a


Figure 9. van’t Hoff analysis
of changes in thermodynamic parameters for thermal transitions shifted by the
addition of 0.5 mM
Mg2+. a) Increase in Tm. b)
Change in van’t Hoff transition enthalpy. c) Change in transition entropy. d)
Change in free energy of transition.
van’t Hoff analysis – substrate binding
After reviewing our notes, an unintentional alteration was made in the way the substrate assays were carried out. All constructs were assayed in the presence of substrate specifically designed for the wild-type ribozyme (3’-UUC-5’). Even though this is obviously not how we designed the substrate protocol to work, it produced very good results in accordance with the base paring we would expect. First, changes caused by the introduction of 160 nM wild-type substrate in all thermodynamic parameters found by van’t Hoff analysis are shown in Figure 10. The free energy values are proportional to the number of Watson-Crick and wobble pairs possible between the IGS and wild-type substrate, yet much greater than the individual contributions of the base pairs themselves. This is summarized in Table 1.
|
construct |
5’-sequence-3’ 3’-substrate-5’ |
total no. Watson-Crick base pairs possible (bold) |
total no. wobble-pairs possible (italics) |
free energy decrease (kJ/mol) |
|
WT |
GAG UUC |
2 |
1 |
-9.64 |
|
M2 |
GGG UUC |
1 |
2 |
-9.85 |
|
M3 |
GAC UUC |
1 |
1 |
-7.31 |
|
M
2-3 |
GGC UUC |
0 |
2 |
-6.90 |
Table 1. Possible base pairing and associated free energy change in the presence of wild-type substrate.
d c a b

Figure 10. van’t Hoff analysis of changes in
thermodynamic parameters for thermal transitions shifted by the addition of 0.5
mM Mg2+ and 160 nM wild-type substrate, 3’-UUC-5’. a) Increase in Tm. b) Change in van’t Hoff transition enthalpy.
c) Change in transition entropy. d) Change in free energy of transition.
Conclusions
Feasibility of the speed protocol may be caused in part by storing the stock RNA in Rnase-free water instead of buffer. This may maintain the RNA in a loosely denatured state that is less prone to getting stuck in local folding energy minima. Also, multiple ramps and slower ramp speeds might be unnecessary when melting an RNA that is considerably larger than the small tRNAs and hairpins that others have developed the thermal melting technique with. A population of RNA molecules as large as Anabaena ramped past their Tm several times, as with the standard protocol, might just naturally exist in an array of folding states as wide as an inhomogeneous sample just taken from the freezer and thawed as with the speed protocol.
The unexpected results from the derivative analysis method were mostly likely due to discrepancies between where the true melting point the molecules was and where they were denaturing the fastest. The derivative method assumes the melting point to be at the steepest point of the raw absorbance curve however this appears to be a poor approximation at times. The van’t Hoff definition of Tm, where 50% of the molecules are in each state, gives a more consistent and predictable value for the melting point as well as better correlation with values for the free energy transition.
The derivative method did however expose the possible low-temperature tertiary structural transition in certain data sets. If this is indeed a structural element, higher concentrations of RNA could be used to amplify absorbance making it easier to see. Also focusing ramps on this low-temperature region may better display its behavior and enable quantified analysis.
Free energy changes caused by magnesium alone and magnesium combined with substrate supported how each mutation would be expected to alter the ribozymes thermodynamic character. Positions 2 and 3 in the IGS both have been shown to be equally involved in binding magnesium at the core of the ribozyme. Substrate assays show these mutations also cause losses in structural stability greater than the free energy lost by fewer base pairs in the P1 region.
Acknowledgement
I am indebted to Professor Christopher Rohlman for overseeing this project from start to finish and assisting at each stage along the way. I would also like to thank the Pomona College Department of Chemistry for funding this study over the course of one summer and two academic semesters, Ethan Levesque ’00 for his prior work in catalytic characterization the mutant constructs, and Julie Pantaleoni ’00 for her notes on operating the Cary300.
References
Atkins,
P. Physical Chemistry. 6th Ed. W.H.
Banjeree, A. R., Jaeger, J. A., Turner, D. H. Thermal Unfolding of a Group I
Ribozyme: The Low-Temperature Transition Is Primarily Disruption of Tertiary
Structure. (1993) Biochemistry 32, 153-163.
Bassi G. S., Murchie A. I., Walter F., Clegg R. M., Lilley D. M. Ion-induced folding of the hammerhead
ribozyme: a fluorescence resonance energy transfer study. (1997)
EMBO J. 16, 7481-9.
Beaudry, A. A., Joyce, G.
F. Minimum
secondary structure requirements for catalytic activity of a self-splicing
group I intron. (1990)
Biochemistry 29, 6534-9.
Brandon,
C., Tooze, J. Introduction to protein
structure.
Breslauer, K. J. Extracting Thermodynamic
Data from Equilibrium Melting Curves for Oligonucleotide
Order-Disorder Transitions.
(1987) Methods in Enzymology
259, 221-243.
Brion, P., Michel F.,
Schroeder R., Westhof E. Analysis of the cooperative
thermal unfolding of the td intron of bacterophage
T4. (1999) Nucleic Acids Research 27, 2494-2502.
Campbell T. B., Cech T.R. Mutations in the Tetrahymena
ribozyme internal guide sequence: effects on docking of the P1 helix into the
catalytic core and correlation with catalytic activity. (1996) Biochemistry 35, 11493-502.
Cate J. H., Gooding A. R., Podell
E., Zhou K., Golden B. L., Kundrot C. E., Cech T. R., Doudna J. A.
Crystal structure of a group I ribozyme domain: principles of RNA packing. (1996) Science
273, 1678-85.
Cech, T. R. Structure and Mechanism of the Large
Catalytic RNAs: Group I and Group II Introns and Ribonuclease
P. The RNA World.
Cech, T. R., Zaug, A. J., Grabowski, P. J. In Vitro
splicing of the ribosomal RNA precursor of Tetrahymena:
Involvement of a guanosine nucleotide in the excision
of the intervening sequence. (1981) Cell 27, 487-496.
Chen, S. J., Dill, K. A. RNA
folding energy landscapes. (2000) Proc.
Natl. Acad. Sci.
Davies, R. W., Waring, R. B.,
Ray, J. A., Brown, T. A., Scazzocchio, C. Making ends meet: a model for RNA splicing in
fungal mitochondria. (1982) Nature 300,
719-724.
Davilia-Aponte, J. A.
A Comparative study of Group I introns Anabaena
Ankistrodesmus,
and Tetrahymena. (1993)
Doherty, E., Herchlag D., Doudna J. Assembly of an Exceptionally Stable RNA
Tertiary Interface in a Group I Ribozyme.
(1999) Biochemistry
38, 2982-2990.
Doudna, J. A., Cormack, B. P., Szostak, J. W.
RNA structure, not sequence, determines the 5' splice-site specificity of a
group I intron. (1989)
Proc Natl Acad Sci
U S A. 1989 86, 7402-6.
Frier, S. M., Kierzek, R., Jaeger, J. A., Sugimoto,
N., Caruthers, M. H., Nielson, T., Turner, D. H. Improved free-energy
parameters for predictions of RNA duplex stability. (1986) Proc. Natl. Acad. Sci. USA 83, 9373-9377.
Jaeger J. A., Turner, D. H., Zuker,
M.
Improved predictions of
secondary structures for RNA. (1989) Proc Natl
Acad Sci U S A. 86, 7706-10.
Joyce, G.F. RNA
structure. Ribozyme evolution at the crossroads. (2000) Science 289, 401-2.
Kuhsel M.G., Strickland
R., Palmer J. D. An
ancient group I intron shared by eubacteria and
chloroplasts. (1990) Science 250, 1570-3.
Kuo LY, Cech TR.
Conserved thermochemistry of guanosine
nucleophile binding for structurally distinct group I ribozymes. (1996) Nucleic
Acids Res. 12, 3722-7.
Mathews,
D.H., Sabina, J., Zuker, M., Turner, D.H. Expanded Sequence
Dependence of Thermodynamic Parameters Improves Prediction of RNA Secondary
Structure. (1999) Journal
of Molecular Biology 288, 911-940.
McConnell T. S., Herschlag D., Cech T. R. Effects of divalent metal ions on individual
steps of the Tetrahymena ribozyme reaction. (1997) Biochemistry 27, 8293-303.
Michel, F., Jaquier, A., Dujon, B. Comparison of fungal mitochondrial introns
reveals extensive homologies in RNA secondary structure. (1982) Biochimie 64, 867-81.
Puglisi, J., Tinoco I. Jr.. Absorbance Melting Curves of RNA. (1989)
Methods in Enzymology
180, 304-325.
Silverman S. K., Zheng M.,
Wu M., Tinoco I. Jr., Cech
T. R. Quantifying the
energetic interplay of RNA tertiary and secondary structure interactions. (1999) RNA
12, 1665-74.
Strobel S. A., Cech T. R. Minor groove
recognition of the conserved G.U pair at the Tetrahymena
ribozyme reaction site. (1995) Science
267, 675-9.
Tanner M. A., Cech T. R.
Joining the two domains of a group I ribozyme to form the catalytic core. (1997) Science 275, 847-9.
Tanner M., Cech T. Activity and thermostability
of the small self-splicing group I intron in the pre-tRNA(lle)
of the purple bacterium Azoarcus. (1996) RNA 2, 74-83.
Tinoco. I. Jr, Uhlenbeck, O. C., Levine, M.
D. Estimation of secondary structure in ribonucleic
acids. (1971) Nature 230, 362-7.
Tinoco I. Jr., Borer P. N., Dengler, B.,
Levin, M. D., Uhlenbeck, O. C., Crothers,
D. M., Bralla, J. Improved estimation of secondary structure in ribonucleic acids. (1973) Nat New Biol.
246, 40-1.
Turner D.H., Sugimoto, N. RNA structure prediction. (1988) Annu Rev Biophys
Biophys Chem. 17, 167-92.
Voet, D., Voet, J. Biochemistry. 2nd Ed. John Wiley,
Wu M., Tinoco I. Jr.
RNA folding causes secondary structure
rearrangement. (1998) Proc. Natl. Acad. Sci. USA. 95,
11555-60.
Xu, M. Q., Kathe, S. D., Goodrich-Blair, H., Nierzwicki-Bauer,
S. A., Shub, D. A. Bacterial origin of a chloroplast
intron: conserved self-splicing group I introns in cyanobacteria. (1990) Science 250, 1566-70.
Zaug, A. J., Been, M.
D., Cech, T. R. The Tetrahymena
ribozyme acts like an RNA restriction endonuclease. (1986) Nature 324,
429-33.
Zaug A. J., Cech, T. R. The
intervening sequence excised from the ribosomal RNA precursor of Tetrahymena contains a 5-terminal guanosine residue not encoded by the DNA. (1982) Nucleic Acids Res. 10,
2823-38.
Zaug, A., Davila
J., Cech T. R.
Catalysis of RNA Clevage by
a Ribozyme Derived from the Group I Intron of Anabaena
Pre-tRNAleu. (1994) Biochemistry
33, 14935-14947.
Zaug, A. J., McEvoy M. M.,
Cech T. R. Self Splicing of the Group I Intron from Anabaena Pre-tRNA: Requirement for
Base Pairing of the Exons in the Anticodon
Stem. (1993) Biochemistry 32, 7946-7953.
Zuker, M. Computer
prediction of RNA structure. (1989) Methods Enzymol.
180, 262-88.
![]()