![]() |
![]() |
![]() |
![]() |
![]() |
![]() |
![]() |
![]() |
![]() |
![]() |
![]() |
![]() |
![]() |
![]() |
![]() |
![]() |
![]() |
![]() |
![]() |
![]() |
![]() |
![]() |
![]() |
|||||||||||||||||||||
T. Rowe Price Science & Technology Fund This investment started in 1995 for my son's college. I was using Dollar Cost Averaging. Then I came across Silicon Investor and the AIM method. Because I dislike brokers (sorry if you are one!, no offense), I was looking for a way to get the emotion out of investing for myself. Then I read Mr. Lichello's book. Anyway after reading Mr. Lichello's book I started AIM'ng this investment (1 of 10) in late 1997. Today you can see the results! |
|||||||||||||||||||||
as of 04/21/2000 | |||||||||||||||||||||
![]() |
|||||||||||||||||||||
![]() |
|||||||||||||||||||||
![]() |
|||||||||||||||||||||
Picture 2 : Line graph of buys / sells | |||||||||||||||||||||
![]() |
|||||||||||||||||||||
Picture 3 : Bar graph of stock / cash | |||||||||||||||||||||
The spreadsheet above tells the story. Year 2000 was tough for all in this fund. AIM managed efficiently and performed better than B&H. And NOW AIM is building on the managed risk and will gain much faster in the next up cycle. AIM is slowing catching the long term B&H. Being behind 23% at the first of 2001 and now only behind 13%. When and if the fund price hits $39 per share AIM will be even with the long term B&H and surpass them from then on in each insuing cycle. 
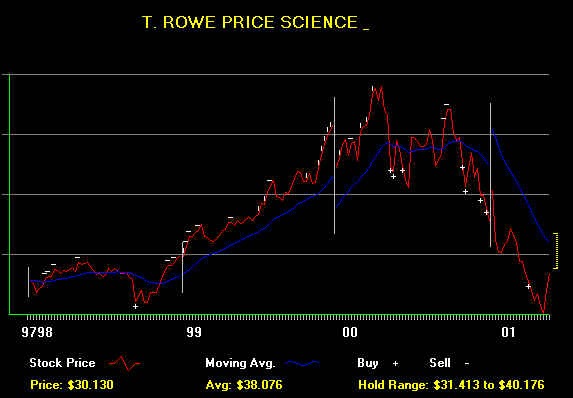
Recalculations were done to include the various distributions to the fund for B&H since '97 (Notice increase in shares). With these calculations it shows B&H outperforming AIM since inception. |
|||||||||||||||||||||
|