SPDRs (Symbol: SPY)
SPDRs trade on the AMEX (AMEX: SPY).The SPDR Trust Series is a pooled investment designed to provide investment results that generally correspond to the price and yield performance, before fees and expenses, of the S&P 500 Index.
There is no assurance that the performance of the S&P 500 Index can be fully matched, but it does allow for more accurate market timing. Quote for SPDRs: SPY
DIAMONDS trade on the AMEX (AMEX: DIA). The DIAMONDS Trust Series is a pooled investment designed to provide investment results that generally correspond to the price and yield performance, before fees and expenses, of the Dow Jones Industrial Average. There is no assurance that the price and yield performance of the Dow Jones Industrial Average can be fully matched. Quote for DIAMONDS: DIA
|
NASDAQ 100 Indicator NASDAQ 100 Advance / Decline Volume Ratio |
The following, shows you the motivating factors that led to the above trades.
|
Trade |
Volume Motivation |
|
Buy Put #1 |
15:45 – 16:00:The market then surged in the last 15 minutes. This move higher was accompanied by a sharp rise in resistive volume going into the close. Using a 15-minute VMA setting, you can see that these last minutes of trading brought an overproduction of resistive volume. |
|
Buy Put #2 |
11:10 – 13:15: The massive VMA peak to the upside seen at 11:10 put an end to the index’s early morning rally and initiated sideways trading action for the next two hours. This phase of trading also ended with the generation of a large VMA spike to the upside, which peaked at about 13:05. |
|
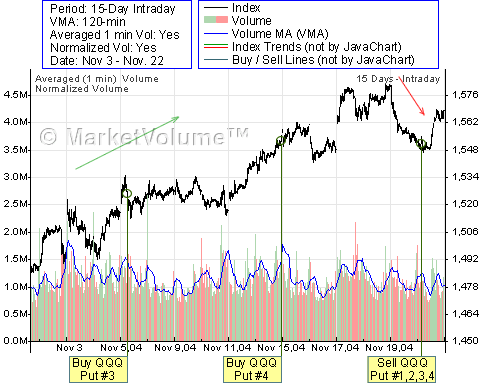
Buy Put #3 |
9:30 – 10:30: The NASDAQ 100 index opened for trading with a 10-point gap up. At about 9:40, a small VMA spike to the downside brought support and reversed the market, which then rallied quickly to its high of the day at 10:30. At 10:25 and 10:30, approximately, we noted two VMA spikes to the upside, which brought resistive volume and ended the market’s rise at 10:30. |
|
Buy Put #3 |
The index surged higher after 14:00 and generated a significant resistive VMA spike (peaking at 14:05) in the process. Another (somewhat smaller) VMA spike to the upside peaked at 14:15. The market continued to rally and generated a further resistive VMA spike at 14:45. The resistive volume that had thus accumulated stalled the ongoing rally and drove the index slightly lower in a move that persisted until 15:10. As the index resumed its ascent to a close at the high of the day, further resistive volume was generated, most notably with VMA spikes to the upside peaking at 15:20, 15:50, as well as going into the close. |
|
Sell Put #1,2,3,4 |
9:30 – 11:45: On the NASDAQ 100 index, trading began virtually unchanged from last Friday’s close. Less than 10 minutes into the day, the bears took control and managed to push the index lower - this generated a first VMA spike to the downside at 10:05. The market recovered and moved up to its first intraday high at 10:20, but this move engendered a VMA spike to the upside, bringing resistive volume. In reaction, the index reversed and started to decline shortly after 10:20, making its low of the day at 10:55. During this downward progression, two VMA spikes to the downside generated supportive volume. These volume surges peaked at 10:40, as well as concurrently with the day’s low at approximately 10:55. Boosted by this supportive volume, the index rose modestly until 11:35, generating a minor amount of resistive volume in the process. The market took a sudden dip at 11:45, and this generated a sharp VMA spike to the downside that peaked shortly after at 11:45. |
These are the trades which netted the returns shown above:
|
Date |
Trade |
Strike |
Expiration |
Contracts |
Contract |
Amount |
Profit |
|
10/26/2004 |
Buy Put #1 |
$36 |
Dec. - QQQXJ |
75 |
$1.25 |
-$9375 |
|
|
11/22/2004 |
Sell Put #1 |
$36 |
Dec. - QQQXJ |
75 |
$0.1 |
+$750 |
-$8,625 |
|
10/27/2004 |
Buy Put #2 |
$36 |
Dec. - QQQXJ |
110 |
$0.85 |
-$9350 |
|
|
11/22/2004 |
Sell Put #2 |
$36 |
Dec. - QQQXJ |
110 |
$0.1 |
+$1100 |
-$8,250 |
|
11/05/2004 |
Buy Put #3 |
$38 |
Dec. - QQQXL |
125 |
$0.9 |
-$11250 |
|
|
11/22/2004 |
Sell Put #3 |
$38 |
Dec. - QQQXL |
125 |
$0.5 |
+$6250 |
-$5,000 |
|
11/12/2004 |
Buy Put #4 |
$38 |
Dec. - QQQXL |
125 |
$0.55 |
-$6875 |
|
|
11/22/2004 |
Sell Put #4 |
$38 |
Dec. - QQQXL |
125 |
$0.5 |
+$6250 |
-$625 |
| Total: |
-22,500 |
||||||
 |  |  |