
MarketVolume's services were developed for trading the derivatives of the major US indexes and exchanges. Their analysis is based on intraday volume and is currently the most advanced method of market timing currently available anywhere.
No matter what trading style you prefer, you must always follow the general market trend determined in MarketVolume's Market Stage.
Straightforward Buy and Sell Signals for QQQQ trading
These signals were designed to satisfy the demands of mid- and long-term QQQQ traders who want to only make 10 to 20 conservative trades during the year, but still make a good return.
They offer two types of ETFs (QQQQ, SPDRs and DOW) signals:
Second Method of Making Money
Long-term traders who want to conservatively trade indexes and index derivatives would be best suited for this method. Only 5-10 conservative trades per year are needed to follow this trading method, and no quantitative analysis need be done!
All you need to do is follow the Market Stage section of the Market Commentary, where you will find what the long-term trend is for all the major indexes
Third Method to Make Money
Mid-term traders who want to trade indexes and their derivatives can follow this method and only make 5-10 trades per month. For this method of trading you don't need to perform much analysis of our charts, but it is suggested that you do pay attention to them and at least take a look at them once a day.
To follow this method of making money you can use MV's chart of VMA spikes to determine mid-term correction points. You can also use MV's Market Stage for general trends and the Market Status for mid-term trends.
Forth Method of Making Money
This method is geared towards short-term active traders who want to trade index derivatives and make approximately 5-10 trades per week.
To follow this method of making money we suggest that you keep track of our volume charts on an intraday basis and learn to analyze volume on your own. Of course MV's Market Commentary can be used to supplement your trades, but we highly suggest that active traders learn to analyze volume on the fly
Fifth Method to Make Money
Mid and long-term players who want to trade QQQQ shares or any NASDAQ 100 index derivative, such as options or futures, can take advantage of our ETFs (QQQQ, SPDRs and DOW) Signals! You'll only need to make about 10-20 trades in a year!
All you need to do is log onto the site once a day and check our updated QQQQ Signals. Call your broker and place an order based on our advice! The main advantage to this system is that you don't need to learn any complicated timing systems in order to profit from QQQQ trading.
For
mid-term traders you must keep track of both the Market Stage and
the Market Status sections of the Market Commentary. Since mid-term traders are
interested in time-spans of about a week or two, it is important to know what
the daily fluctuations and mid-term movements might be. Therefore we suggest
that a mid-term trader also keep track of our Volume Charts on at least a daily
basis in order to understand where the market might move in the next few days.
For mid-term traders it is still important to know what the general market trend is, as you don't want to trade against the market if you plan on holding your position for more than a day. We recommend that during Resistance and Support Corridor stages, you close open positions and stay in cash due to increased market volatility during this period.
We suggest that before making any trading decisions you compare our Market Status with the results of your analysis. Analysis can be divided into two stages. 15-day and 30-day intraday charts with a 120-minute Volume Moving Average (VMA) are excellent for general mid-tern analysis. 5-day charts with a 60-minute VMA are also excellent for analysis of particular volume spikes. Large VMA spikes will show you when institutional traders are buying and selling.
You do not have to spend every day in front of your monitor analyzing charts and waiting for signals. It is often enough for a mid-term trader to spend just a short time before or after the trading day by analyzing volume behavior for the past day. After you have found the levels of volume that you think could cause the market to make a mid-term directional change, all you need to do is set an alert for volume or price and you will be notified once that level has been reached.
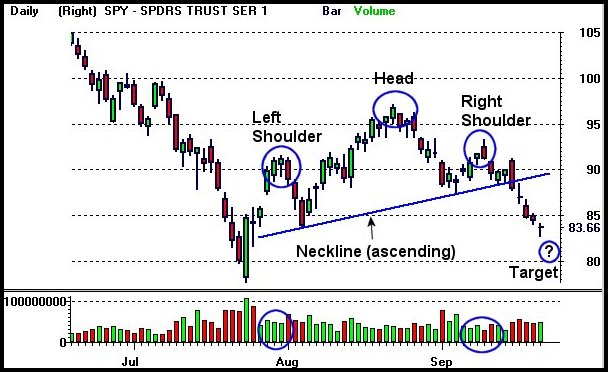
This example shows the basis of MV's analysis. Traders can see in our charts the relationship between the index price and the Volume Moving Average.
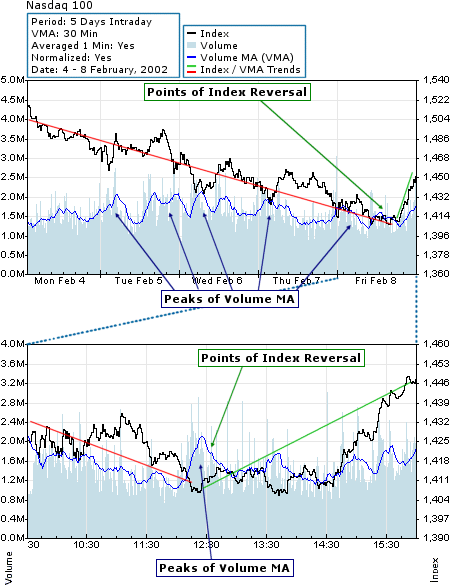
The above chart was extracted from our JavaVolume Charting technology. These charts enable you to predict future market movements and trends by giving you access to real-time volume and index data, which include a volume moving average, index moving averages, up/down volume, the ability to draw trendlines directly on the chart, as well as many other features no listed here.
Above you can see the mid-term relationship between price and volume. An increase in volume subsequently affects the movement of price, causing it to change direction.
You can see that almost every time the Volume Moving Average peaks, the index reacts. One can make many profitable trades knowing this.
The blue line in the chart is a trend of Volume, which we call the Volume Moving Average (VMA).
This example shows the basis of MV's analysis. Traders can see in our charts the relationship between the index price and the Volume Moving Average.
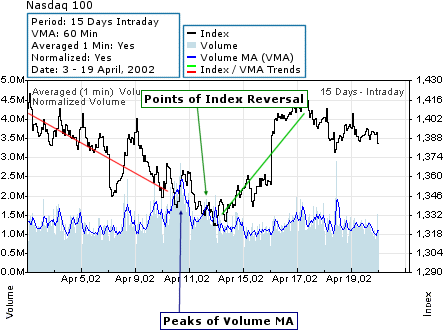
The above chart was extracted from our JavaVolume Charting technology. These charts enable you to predict future market movements and trends by giving you access to real-time volume and index data, which include a volume moving average, index moving averages, up/down volume, the ability to draw trendlines directly on the chart, as well as many other features no listed here.
Above you can see the long-term relationship between price and volume. An increase in volume subsequently affects the movement of price, causing it to change direction.
You can see that almost every time the Volume Moving Average peaks, the index reacts. One can make many profitable trades knowing this.
The blue line in the chart is a trend of Volume, which we call the Volume Moving Average (VMA).
This example shows the basis of MV's analysis. Traders can see in our charts the relationship between the index price and the Volume Moving Average.
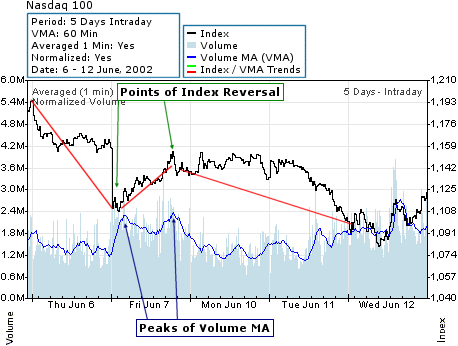
The above chart was extracted from our JavaVolume Charting technology. These charts enable you to predict future market movements and trends by giving you access to real-time volume and index data, which include a volume moving average, index moving averages, up/down volume, the ability to draw trendlines directly on the chart, as well as many other features no listed here.
Above you can see the short-term relationship between price and volume. An increase in volume subsequently affects the movement of price, causing it to change direction.
You can see that almost every time the Volume Moving Average peaks, the index reacts. One can make many profitable trades knowing this.
The blue line in the chart is a trend of Volume, which we call the Volume Moving Average (VMA).


 |  |  |