Just to mention again, the source for this image comes from the GeoConnections Discovery Portal website. It is from the Landsat 5 TM Data over Major Canadian Cities geospatial dataset, found at this site. By clicking on the charlottetown/ file, you will be directed to the Charlottetown index, where the file charlottetown_100_ic.zip can be downloaded. When downloaded, the image file, charlottetown_100_ic.tif can be viewed.
* It should be noted that finding remotely sensed images was difficult at first. Unless a website is known, much time is required to search for the data and downloading also took some time. As well, when the data was downloaded, all the formats were not appropriate for use (i.e., .jpg could not be used because of lost compressed data). However, once downloaded, appropriate files needed to be extracted because their large size had been compressed.
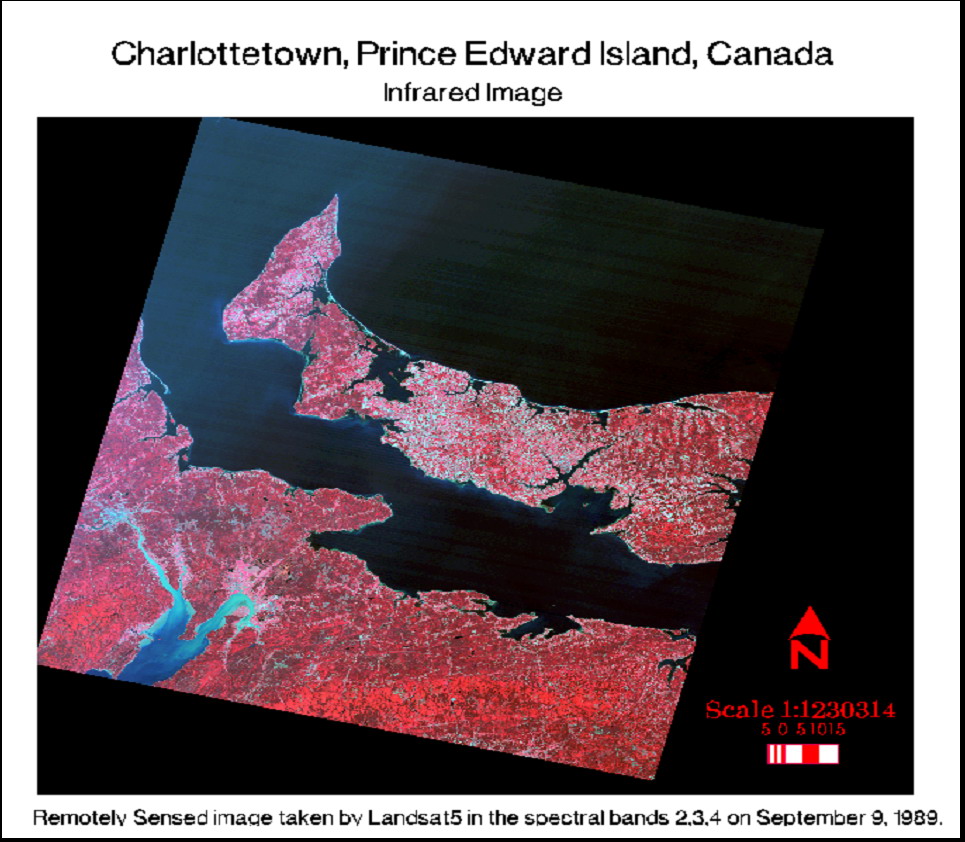
Image Details for Figure 3.1
Data type: image file, .tif format
Source: GeoConnections Discovery Portal, Landsat 5 TM Data over Major Canadian Cities, Government of Canada.
Satellite: Landsat 5
Sensor: Thematic Mapper (TM)
Date of acquisition: September 9, 1989
Geographic location: Charlottetown, Prince Edward Island, Canada
Coordinates: (From the four corners of the image) Datum: NAD 83,
Projection: UTM, Zone 20
Northwest: Northing / Easting 5237800 / 339025
Northeast: Northing / Easting 5237800 / 589025
Southwest: Northing / Easting 5012800 / 339025
Southeast: Northing / Easting 5012800 / 589025
Rows and Columns: 27/28 and 8
Spatial resolution: 25 x 25 metres
Radiometric resolution: 8 bits unsigned per band
Spectral resolution: 3 spectral bands (TM2, TM3, TM4)
Source: cd charlottetown 03.txt file from the charlottetown/ directory mentioned above, (GeoConnections Discovery Portal 2007). This file provides the metadata for this image.
This image is displayed with the 3 spectral bands 2, 3, 4 (green, red, and near infrared). They were viewed through the red, green, and blue channels in the order 4, 3, and 2 of the TM sensor. The red in the image depicts vegetation, especially areas with intense shades of red. The black portions of the map are water bodies, while the cyan colour around the coast represents sediments dispersed in the water due to tidal action or shallow water levels. The lighter red shades and brown colours represent bare ground and some built up areas while the white also shows built up areas and other human structures.
Since the Landsat 5 satellite can produce images with bands 1, 2, 3, 4, 5, 6, and 7, another image of Charlottetown is available in the spectral bands 1, 2, and 3 (viewed as 3, 2, and 1 through the red, green, and blue channels). For example, the GeoConnections Discovery Portal website also provided the view in a natural colour composition. Figure 3.2 displays this view. This image was also downloaded from the charlottetown/ folder and its file name is charlottetown_100_nc.jpg.

Being able to choose the spectral bands for viewing allows for certain features of an area to be "highlighted" or concentrated on. This type of control makes remote sensing a beneficial discipline because it can be applied to many academic subjects. By viewing the natural colour composite image of Figure 3.2, it becomes apparent that the vegetated areas in Figure 3.1 show up as more intense shades of red, while the built up areas appear as white and cyan.
Other spectral combinations can be created to better emphasize land types or the qualities of a surface. Again, this is important because much "noise" or unwanted information can be pushed to the background, and the details that require attention are more prominent. Figure 3.3 is another way that Charlottetown can be viewed.

There are obvious differences between Figures 3.1, 3.2 and 3.3 in terms of colour. This is because the spectral combinations vary for each of them. Although all three cover the same geographical area, some may be better at portraying some types of information than others. For example, Figure 3.3 shows more details of the water body in the lower left portion of the images. This image also has less variation on vegetated surfaces, while Figure 3.1 seems more sensitive to vegetation type.
For more differences between these images, click here to view some statistics.
As well, if you are interested in remote sensing and would look some questions answered, visit the following links:
Environmental Photographic Interpretation Center of the U.S. Environmental Protection Agency
NEODC tutorial and self-help pages. NERC Earth Observation Data Centre (NEODC) is part of the Natural Environment Research Council (NERC) and its goal is obtain, store and provide remotely sensed data of the Earth (NERC Earth Observation Data Centre 2007).
(Images for this page are from my F drive, under the folders, GEOG 4440 3.0 Assignment 0, and Charlottetown.)