|
|
| Home |
| PPD |
| Sites |
| ABdA |
| Help |
|
WEEK 12: DISTRIBUTION: FACTORS
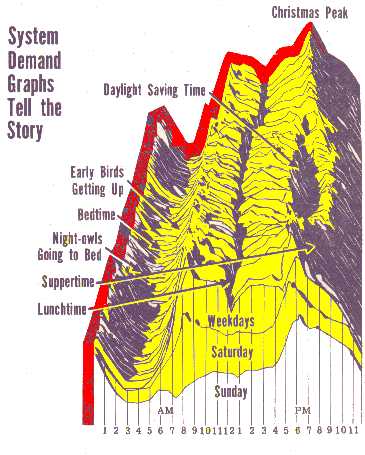
Maximum Demand The amount of electricity a consumer uses at any given moment is called the demand. It varies from hour to hour. The highest value which the remand reaches is called the maximum demand, or the peak load. It determines the size and type of equipment necessary to supply the consumer. The higher the maximum demand, the larger and more expensive must be the apparatus necessary to carry it. The maximum demand may exist for only a very short while or it may last for a considerable period. For practical purposes it is taken as the highest 15-minute (or half-hourly or hourly) demand during the billing period. Load Duration Curves are plotted by the number of hours during which a kilowatt of energy is demanded. Annual load curves are obtained from the same data as the daily load curves for one year (8760 hours). Annual load curves show less variations than daily load curves. The peak load for the year, referred to as the system peak, often occurs during the two weeks before the end of the year, around the Christmas season. With the widespread use of air-conditioning units, this system peak often occurs during the summer months. Peaks are always higher for weekdays than for Saturday and Sunday. Weather and special events cause variations in this pattern. A summer storm will put the evening load at its cold months peak. The evening load may be extended by some special radio or television program after 9 p.m. Sections: Load | Demand | Diversity | Economics | Losses Load Factor is the ratio of the average demand compared to the maximum demand, an estimate of the extent to which the facilities are used. Even though the capacity of the installation is determined by the maximum demand, the load factor is of great importance because the use (and consequently the revenue) from the installation is governed by the average load. Each use of electrical energy has its own characteristics. The street lighting load--while it is on--has almost a 100% load factor. The domestic (residential) load factor has a very high evening peak and varies enormously depending upon the appliances used. Industrial curves vary with the specific industry but generally are typified by two peaks, one in the morning and one in the afternoon. Use Factor is the ratio of the average demand compared to the capacity installed. Sections: Load | Demand | Diversity | Economics | Losses Demand Factor is the ratio of the maximum demand to the total load connected. For example, if a residence having a 6000W-rated equipment connected has a maximum demand of 3300W, it has a demand factor of 55%. The lower the demand factor, the less system capacity required to serve the connected load. Sections: Load | Demand | Diversity | Economics | Losses Coincidence or Diversity Factor Diversity Factor, expressed in percent, is the comparison of the actual maximum demand of all consumers on the feeder to sum of maximum demands supplied by the feeder (regardless of when they occur). This factor can, therefore, never be less than one or may be as high as ten or more. The diversity factor of a feeder would be the sum of the maximum demands of the individual consumers divided by the maximum demand of the feeder. In the same manner, it is possible to compute the diversity factor on a substation, a transmission line or a whole utility system. The smaller the load factor, the less chance of the maximum demands of two loads being simultaneous. The residential load has the highest diversity factor. Industrial loads have low diversity factors usually in the neighborhood of 1.4, street light practically unity and other loads vary between these limits.
Coincidence Factor is the ratio of the maximum demand of the load as a whole. measured at its supply point, tot he sum of the maximum demands of the component parts of a load. The diversity factor is the reciprocal of the coincidence factor. Sections: Load | Demand | Diversity | Economics | Losses The most straightforward and generally applicable technique to use in distribution-system investment problems is making economic comparisons on the basis of the present value of all future annual costs. That is, the economic choice is the one with the lowest present value of all future costs. Time Value of Money money does have time value, and rent or interest on its use has to be paid. It is obvious that an alternative which requires the least expenditure immediately would be best, everything else being equal. The process of taking money and finding its equivalent value at some future time is called a future worth or future value calculation. Refer to your economics instructor for more details! [Huh!] Annual Charges A convenient method of calculating the annual costs of capital investments made in an alternative scheme is using a level carrying charge which is expressed as a percentage of the original investment. The total revenue requirements of a piece of equipment are the sum of the annual charges for: (a) Return on Investment, (b) Depreciation, (c) Income Tax, (d) Property Taxes, (e) Insurance, and (f) Operating and Maintenance Expenses. The first five components can conveniently be estimated as a percentage of original investment. The operating and maintenance charges should be separately estimated for each project because they do not relate to capital investment as a percentage. Level Annual Carrying Charges is the percentage by which the capital investment can be multiplied to determine its annual cost in a uniform basis. The value of this carrying charge is very much dependent upon the expected life of the piece of equipment because depreciation varies in accordance with life expectancy. The method of obtaining the level annual carrying charge is as follow: (1) calculate the sum of the annual charges for return of investment, depreciation, income tax, property tax, and insurance for each year of the expected life of equipment; (2) use the appropriate present worth factor with each annual cost to convert the annual cost to a present worth value; (3) sum up these values to obtain the total present worth of the annual carrying charges; and (4) multiply the total present worth by the capital recovery factor to get the uniform annual charge. Sections: Load | Demand | Diversity | Economics | Losses General About 8% of the total output of a large power system is lost and unaccounted for. Much of this loss is in the distribution system. It should not be omitted from overall comparisons of alternative facilities. Line Losses which are the sum of the resistance losses ,I²R, can be found when the currents at peak load are known. Simplifying assumptions can often be make in making these calculations. Transformer Losses comprise of no-load loss as well as load loss. The transformer no-load loss is independent of the load, whereas the load loss will vary as the square of current. These losses for distribution transformers are usually published as no-load and total loss when the transformer is operating at rated voltage and rated kVA. The load loss at full-load current is the difference between total and no-load losses. Refer to Guaranteed Transformer Losses calculations Responsibility Factor Owing to diversity factors between classes of loads on a distribution system, peak loads on distribution, transmission and generation do not usually occur at the same time. Therefore, a loss which contributes 1 kW tot he distribution-system peak might contribute less than this to transmission- and production-plant peak because its maximum does not occur at the same time as the transmission or generation peak. This introduces peak responsibility factors used for evaluating cost of losses in various parts of the system. Loss Factor is defined as the ratio of the average power loss, over a designated period of time, to the maximum loss occurring in that period. The term can refer to any part or all of the electric system. It is sometimes called as the load factor of the losses. A corollary to loss factor is equivalent hours, defines as the number of hours per day, week, month, or year of peak load necessary to give the same total kilowatthours of loss as that produced by the actual variable load over the selected period of time. The relationship between load factor and loss factor at the distribution transformer can be expressed by the empirical formula: Cost of Losses depends on the point in the system at which they occur. The father out on the system the greater value losses have. One kilowatt of loss saved on the secondary system is worth more than 1 kW loss at generation because of the cumulative effect of increments of losses as they pass through various elements of the system. The two parts of the cost to supply losses are Energy component, or production cost to generate kWh losses which is equal to 8760FLE; and the Demand component, or annual costs associated with system investment required to supply the peak KW of loss which is equal to FSP, where FL = loss factor of load, E = cost of energy, dollars/kWh, FS = responsibility factor andP = annual cost of system capacity, dollars/kW·year. Annual cost of losses can be combined into one value with the following formulas: Cost of losses, $/kWh = ( FSP / 8760FL ) + E | ||||||||||||||||||||||||||||||||||||||||||||||||||||||