Previous Page /
Next Page /
Abstract and Contents Page.
Experimental Measurement of Optical Dispersion
An attempted measurement of the effect of dispersion was performed using a sample data-set taken from observations of the bright star  Bootes in April 1997. As the star was not directly overhead at the time of measurement, the light in one of the incoming beams had to travel for a greater distance through air. This beam should thus have been slightly more dispersed. The optical filter used in the experiment had a band-pass of 750nm to 850nm wavelength, or wavenumbers 7.39×
106 m-1 to 8.38×
106 m-1. Figure 29 shows the degree of dispersion induced by one metre of path length through air.

Figure 29 - Optical dispersion in air (based upon Kaye and Laby, Tables of Physical and Chemical Constants). The units used correspond to change in optical path length per unit change in wavenumber.
In the experiment, one of the beams passed through roughly six metres more air than the other. It can be seen from Figure 29 that this would cause additional dispersion of approximately 3.9×
10-12 m2. If the data from each sweep were Fourier transformed, the point where the optical path lengths to the star were equal along both beams would be expected to vary with the frequency of the Fourier component. This should lead to a non-zero second derivative for a plot of phase against Fourier component.
The second derivative of phase w.r.t. frequency can be calculated from the phase of the following number:

where G( ) is the Fourier component of the carrier-wave at frequency
  .
.
A change of one Fourier component in the carrier-wave corresponds to a change in optical wavenumber of:

Where the "length of the sweep" here corresponds to the total distance travelled by the fringe envelope in each sweep when the delay line modulation is applied.
This change in wavenumber would produce a change in the optical path difference of:

or

when measured as a fraction of the length of the sweep.
The change in the path difference should be reflected in the phase of D as follows:

in this case.
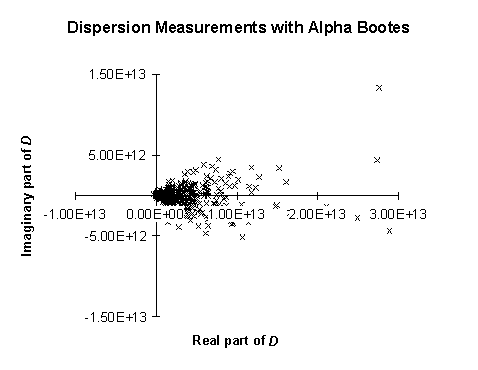
Figure 30 shows a plot of calculated values for D for each sweep in 50 seconds of data. The random noise in measurements of the phase of D is larger than the actual phase of D that is expected on theoretical grounds. This attempt at measuring the difference in dispersion between the incoming beams has thus proved inconclusive.

Figure 30 - Calculated values for D taken from 50 seconds of data. The random noise is thought to come primarily from atmospheric phase fluctuations, and it prevents accurate measurement of the phase of D. The standard error in the measurement of the mean phase of D is 0.03 radians, larger than the expected value of D. The measured mean phase from the data was 0.01 radians.
Previous Page /
Next Page /
Abstract and Contents Page.
Return to Bob's Interferometry Page.
Return to Bob's Home Page.
 Bootes in April 1997. As the star was not directly overhead at the time of measurement, the light in one of the incoming beams had to travel for a greater distance through air. This beam should thus have been slightly more dispersed. The optical filter used in the experiment had a band-pass of 750nm to 850nm wavelength, or wavenumbers 7.39×
106 m-1 to 8.38×
106 m-1. Figure 29 shows the degree of dispersion induced by one metre of path length through air.
 ) is the Fourier component of the carrier-wave at frequency
