Announcements and News:
Site Navigation:


Page address:
File created:
Sep 5, 1998
Last modified:
Aug 30, 2004
Definitions:
Double-click on any word
Announcements and News: |
These are links to some of the pictures and web pages displayed on the classroom computer during this Section of the course. Most of them were displayed at full screen width so they could be seen better by all students. Teachers: Instructions on displaying pictures of your choice are at the bottom of the page.
| Coming soon: Course Overview Pictures (http://www.oocities.org/CapeCanaveral/7639/pic1.htm): This is a "slide show" of the photos on the printed course description. Each picture represents a different facet of the course. Some of them have links to the source of the picture. |  |
|
Global Population and Arable Land (http://www.oocities.org/capecanaveral/7639/foundtns/javapop2.htm): This displays a constantly increasing world population and decreasing area of arable land. It has a link to the original page. |
|
|
Global Population Growth graph from the Population Reference Bureau at http:// www.prb.org/ Content/ NavigationMenu/ PRB/ Educators/ Human_Population/ Population_Growth/ Population_Growth.htm |
.gif)
|
|
Status of Women and Birth Rates graph from the Population Reference Bureau at http:// www.prb.org/ Content/ NavigationMenu/ PRB/ Educators/ Human_Population/ Women/ The_Status_of_Women1.htm |
.gif)
|
|
Another
Status of Women and Birth Rates graph from the Population Reference Bureau at http:// www.prb.org/ Content/ NavigationMenu/ PRB/ Educators/ Human_Population/ Women/ The_Status_of_Women1.htm |
.gif)
|
|
Growth of Urban Areas graph from the Population Reference Bureau at http:// www.prb.org/ Content/ NavigationMenu/ PRB/ Educators/ Human_Population/ Urbanization2/ Patterns_of_World_Urbanization1.htm |
.gif)
|
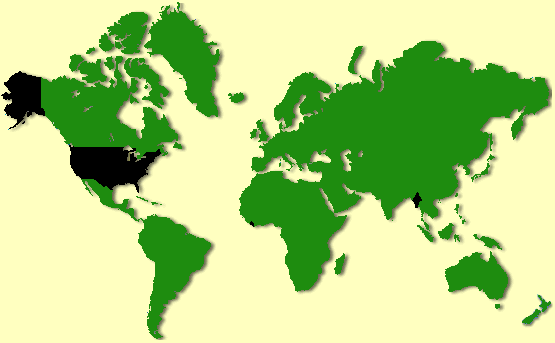
| Where in the world do they not use metric system? (http://www.oocities.org/capecanaveral/7639/foundtns/metricmap.htm) From http://www.metric4us.com/ |
 |
| Burlington Brook Streamflow (http://ct.water.usgs.gov/rt-cgi/gen_graph?station=01188000&format=presentation&parm=q)This graph shows current volume of flow, we use it to calculate predicted streamflow. From http://ct.water.usgs.gov/rt-cgi/gen_stn_pg?station=01188000 |
|
| US Water Consumption (http://ga.water.usgs.gov/edu/charts/pietotal.gif) We used this to introduce the Streamflow Fieldwork. From http://ga.water.usgs.gov/edu/graphicshtml/totpie95.html |  |
| Metric Volume Conversion Tables from http://www.french-property.com/ref/convert.htm#volume |
To display other pictures from the web at full screen width, you can use the html code from any of these files:
1. You need to get the full internet address of the picture you want to display. An easy way to do this is to right mouse click on the photo, then choose "properties". Write down the address of the picture.
2. When you are on one of the pages above that you want to use to display your own picture, select "View" from the menu bar at
the top of your browser screen, then "Source" (this is for ms internet explorer
- Netscape has something similar).
3. On the page of code you see, find the brackets: <.....> that have something like this bewtween them:
img src="//www.blah.blah/blah.blah" width="100%"
4. Replace the address of the picture with the address of the one you want to display.
5. Save the file somewhere where you can find it on your computer. you can use file-open-browse to view it. Press F11 to maximize the display of any web page.


Page address: