
 voyagers since March 3rd, 2003.
| series title | chart/graph of | |
|---|---|---|
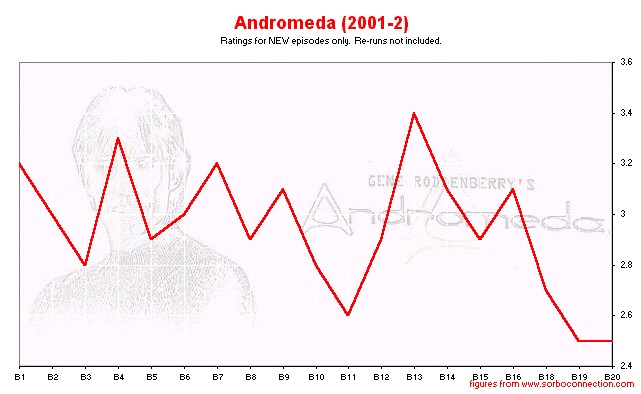
| Andromeda | | |
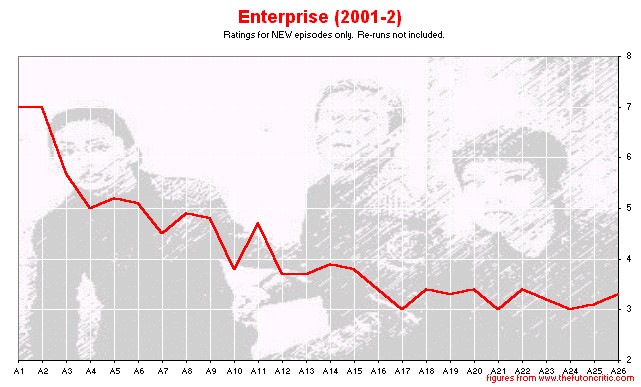
| Enterprise | | |
| Firefly | | |
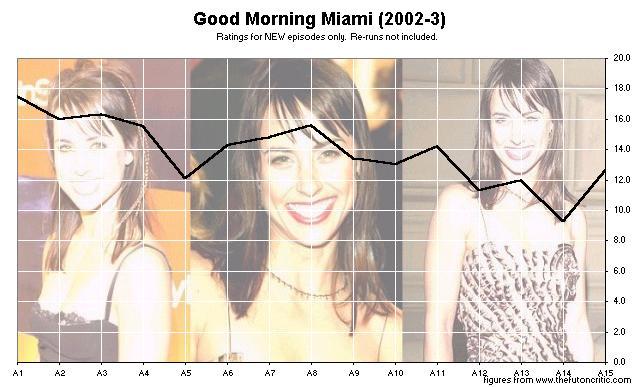
| Good Morning Miami | | |
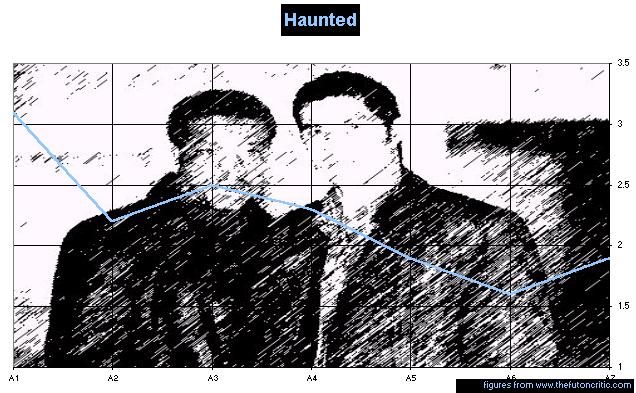
| Haunted | | |
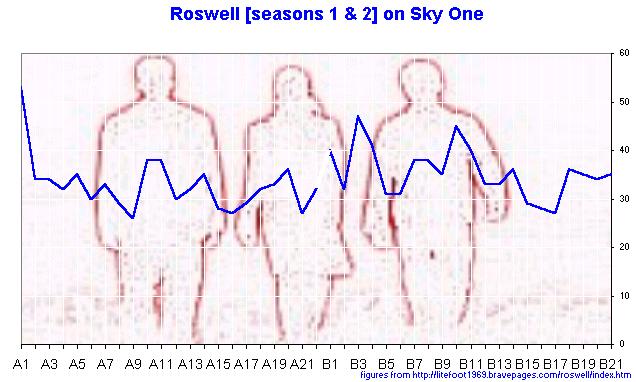
| Roswell | | |
| Roswell | | |
| Roswell | | |
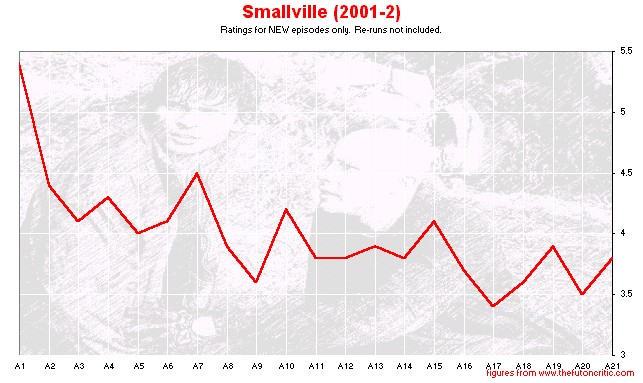
| Smallville | |
Television Charts/Graphs
As of this moment, the newest graphs on this page are the ones for Haunted, Roswell and Good Moring Miami, all added on March 25th.
voyagers since March 3rd, 2003.
| series title | chart/graph of | |
|---|---|---|
| Andromeda | | |
| Enterprise | | |
| Firefly | | |
| Good Morning Miami | | |
| Haunted | | |
| Roswell | | |
| Roswell | | |
| Roswell | | |
| Smallville | |
|
A BRIEFING WITH MICHAEL |