|
Question:
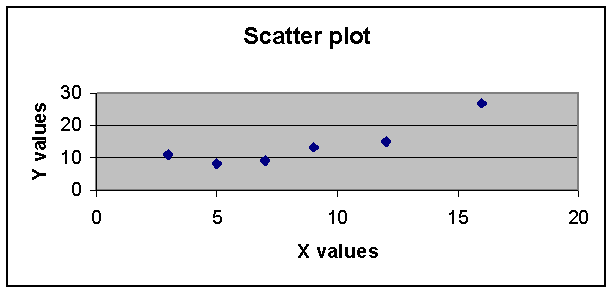
Problem 12.53: Use the following data for (a)
through (f)
| x |
5 |
7 |
3 |
16 |
12 |
9 |
| y |
8 |
9 |
11 |
27 |
15 |
13 |
|
a. Determine the equation of the
least squares regression line to predict Y by X.
b. Using the X values, solve for the predicted values of Y and the
residuals.
c. Solve for Se
d. Solve for r2
e. Test the slope of the regression line. Use =  .01 .01
f. Comment on the results determined in (b)-(e) and make a statement
about the fit of the line.
a. Solve for the regression line:
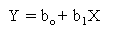
b1 =  (slope of the regresion line)
b0 =  (Y
Intercept of the regression line) (Y
Intercept of the regression line)
 X
= 52 X
= 52
Y
= 83
XY
=
865
x2
= 564
Regression line: Y = 2.6941 + 1.2853X
-----------------------------------------------------------------------------------------------------------------------------------------------------------------
b. Solve for the residuals:
Given the regression equation: Y = 2.6941
+ 1.2853X
Substituting the values of x into the regression line will give
us the predicted value of Y. Residuals can be computed by deducting
the predicted value of Y from the historical value of Y.
| X |
Y |

(predicted value of Y) |
Y - (residuals) |
| 5 |
8 |
9.1206 |
-1.1206 |
| 7 |
9 |
11.6912 |
-2.6912 |
| 3 |
11 |
6.55 |
4.45 |
| 16 |
27 |
23.2589 |
3.7411 |
| 12 |
15 |
18.1177 |
-3.1177 |
| 9 |
13 |
14.2618 |
-1.2618 |
|
-----------------------------------------------------------------------------------------------------------------------------------------------------------------
c. Solve for Se (Standard Error of the Estimate):
| |
x |
y |
y2 |
xy |
x2 |
| |
5 |
8 |
64 |
40 |
25 |
| |
7 |
9 |
81 |
63 |
49 |
| |
3 |
11 |
121 |
33 |
9 |
| |
16 |
27 |
729 |
432 |
256 |
| |
12 |
15 |
225 |
180 |
144 |
| |
9 |
13 |
169 |
117 |
81 |
|
52 |
83 |
1389 |
865 |
564 |
|
Compute for SSE (Sum of squares Error) first.
SSE formula: 
b0 = 2.6941
b1 = 1.2853
SSE = 1389 - 2.6941(83) - 1.2853(865)
SSE = 53.6047
Then compute for Se (Standard Error of the Estimate)
Se formula:
Se = sqrt. of (53.6047 / 4)
Se = 3.661
-----------------------------------------------------------------------------------------------------------------------------------------------------------------
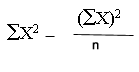
d. Solve for r2 or coefficient of determination:
proportion of variability of the dependent variable accounted for
or explained by the independent variable.
r2
formula: 
r2 = 1 - (53.6047 / (1389-1148.166667)
)
r2 = 1 - (53.6047 / 240.833333)
r2 = 1 - .222580069
r2 = .77741993 or
.77
-----------------------------------------------------------------------------------------------------------------------------------------------------------------
e. Test the slope of the regression line
with alpha of .01
Y model : 
Test if slope is equal to zero.
H0 : b1
= 0
Ha : b1
<> 0
This is a two-tailed test:
= .01 /
2 = .005
df = n-2 = 4
t
value from table A.6 = 4.604
Solve for computed value of t:
t
formula: 
SSxx
= 
SSxx
=
113.3333333
Se
= 3.661
Sb = 
Sb = .343891069
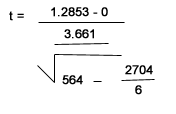
t = 3.737520728
Graph:
Interpretation:
We fail to reject the null hypothesis.3.73 lies in the non-rejection
region. The slope is equal to 0. The regression model does not add
more predicative information than the Y model of no regression or
simply getting the average of Y.
-----------------------------------------------------------------------------------------------------------------------------------------------------------------
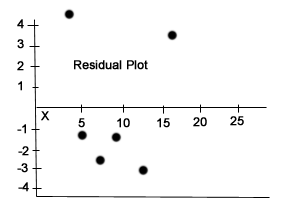
f.
Comments :
Residuals: Based
on the residual plot, we make the following observations.
- Since a straight line cannot be drawn between the residual points,
the residuals are not normally distributed.
- There appears to be a definite rising and fallling pattern among
the residuals, which strongly suggests a violation of the regression
assumption of independence of error terms.
- The graph seems to indicate non constant error variances.
Standard
Error of the Estimate (Se): 3.661
3.661is the standard deviation of the error.
If the error terms are normally distributed, the empirical rule
states that given the values of X, approximately 68% of the error
terms would be within + - 3.661 and 95% would be within + - 2(3.661).
Analysis of the residual plot shows that 4 out of the 6 residuals
or 66.67% are within 1 standard error of the estimate (3.661) and
100% are within 2 Se.
Coefficient
of determination
r2 = .77
The coefficient of determination is the proportion of variability
of the dependent variable (Y) accounted for or explained by the
independent variable (X). The coefficient of determination ranges
from 0 to 1. A r2 of .77 or 77% means that 77% of the variability
of Y is accounted for or predicted by X. It also means that 23%
is not explained by the regression model.
Testing
the slope of the regression line
t = 3.73
We
fail to reject the null hypothesis because 3.73 lies in the non-rejection
region. The slope is equal to 0. The regression model does not add
more predicative information than the Y model of no regression or
just simply averaging the Y values.
Fit
of the line:
The regression model failed to reject the
null hypothesis because 3.73 lies in the non-rejection region. The
model therefore is not that good a fit despite an r2 of 77%.
|