|
Manual Solutions:
ANOVA - Analysis of Variance
Step 1: The hypotheses are:
Ho:
Ha: At least one of the means is different from the others
Step 2:
The appropriate test statistic is the F test
calculated from ANOVA.
Step 3:
The value of alpha is .05.
Step 4:
The degrees of freedom for this problem are:
dfc
= C -1
dfc = 3 -1 = 2
dfe = N - C
dfe = 18 -3 = 15
F table A.7 value = F.05,2,15 = 3.68
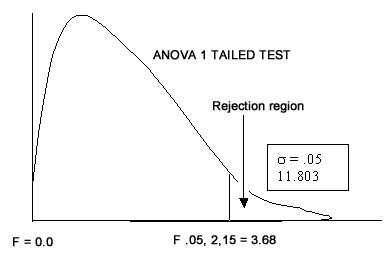
The critical F value is 3.68. Because ANOVAs are always one-tailed
with the rejection
region in the upper tail, the decision rule is to reject the null
hypothesis if the
observed value of F is greater than 3.68.
Step 5:
| |
HIGH
LEVEL |
MIDLEVEL |
LOW
LEVEL |
|
| |
7 |
8 |
5 |
|
| |
7 |
9 |
6 |
|
| |
8 |
8 |
5 |
|
| |
7 |
10 |
7 |
|
| |
9 |
9 |
4 |
|
| |
|
10 |
8 |
|
| |
|
8 |
|
TOTAL(rows): |
 |
38 |
62 |
35 |
135 |
| n |
5 |
7 |
6 |
N
=18 |
 |
7.6 |
8.86 |
5.83 |
7.5 |
Step 6:
Partition the total variance of the data into 2 variances:
a. Variance resulting from the treatment
b. Error variance, portion of the total variance unexplained by
the treatment.
SST
= SSC + SSE
(total sum of squares) = (treatment sum of squares) + (error sum
of squares)
SSC = 
SSC = 
SSC = 29.7306
---------------------------------------------------------------------------
SSE = 

SSE = 18.8906
---------------------------------------------------------------------------
SST = 

SST = 48.5
---------------------------------------------------------------------------
MSC = SSC / dfc
MSC = 29.7306 / 2
MSC = 14.8653
MSE = SSE / dfe
MSE = 18.8906 / 15
MSE = 1.259373333
Computed F =
MSC / MSE
F
= 14.8653 / 1.259373333
Computed
F =
11.80372778
F
table A.7 critical value =
F.05,2,15 = 3.68
Step 7:
The decision is to reject the null hypothesis because the observed
F value of 11.80 is greater
than the critical F table value of 3.68.
GRAPH:

Step
8:
Computed f value
of 11.80 is greater than table f value of 3.68, therefore we reject
the null hypothesis. Not all means are equal. There is a significant
difference in the evaluations depending on the manager levels.
--------------------------------------------------------------------------------------------------------------------
Click below for:
EXCEL SOLUTION
Back to:Finals Main Page
|


