Under Construction 
From 1950-2008 there have been 6 bear markets (Drop of > 20% lasting more than 10 mos.)
| Decline | Years |
| abt. 20% | 56-57, 61-62, 66 |
| 25-30% | 81-82, 87 |
| 30-40% | 70 |
| >40 | 73-34, 2000-02, 2008 |
% S&P drop
1929 Crash - 90%
1937-1942
1946-49 42% 22 mos. Recovery started 3 yrs. after peak.
1956-57 20% 1 yr.
1961-62 21% 8 mos.
1966 20% 10 mos.
1970's 33% 20 mos. Inflation - Recession - Failure of DJIA to break 1,000
1973-74 48% 21 mos. Bear Market - Recession - 48%
1981-82 26% 21 mos. Bear Market - Recession - Discount rate - 14%
2008 - Financial mortgage/lending crisis
 1987 crash - 33% 3.4 mos.- As of 2005 no definite reason for the decline has been isolated.
At the time it was thought to warn of a impending recession, not it apears to have been caused by a new investment strategy involving stock index futures that led to major selling after the first decline. 1987 crash - 33% 3.4 mos.- As of 2005 no definite reason for the decline has been isolated.
At the time it was thought to warn of a impending recession, not it apears to have been caused by a new investment strategy involving stock index futures that led to major selling after the first decline.
See: lope.ca/markets/1987crash/
The 1987 Crash and the Performativity of Economics, Donald MacKenzie
1990 - Savings & loan scandal - 18% 3 mos.
1997 - Asian credit crisis, Russian default and problems with hedge fund, Long-Term Capital Management.
2000-02 Crash - .com bust, (Irrational exuberance) ... - 47% 2 yrs.
2007-08 Sub-prime mortgage defaults, housing bust

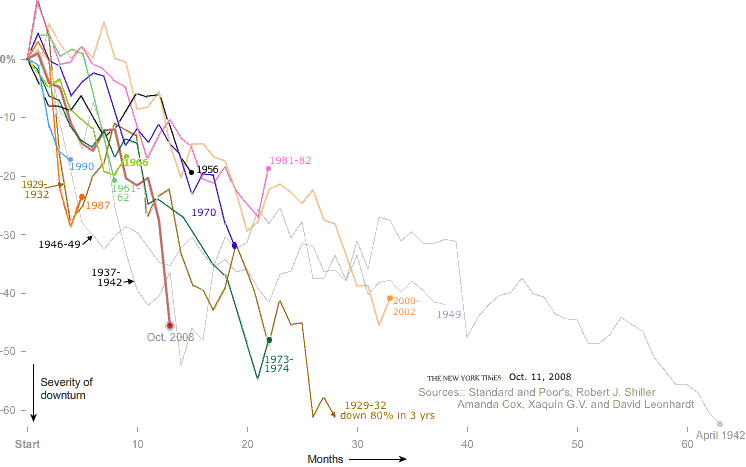
Source: How This Bear Market Compares - NYTimes.com Oct. 11, 2008
See: Bear Market Statistics - Bob Brinker
See Market Volitility
Return to Investing
Send comments and suggestions to
last updated 12 Oct 2008
| 