Under Construction

Contents:
Reference Sources | Charts | October 2008 crash | Economic Indicators | Strategies | Categories (Real Estate, Insurance, Stocks, ...) | Funds (mutual, Index, ETFs)
See Also: Stock Brokers
Reference Sources:

Daily News:
money.cnn.com
Bloomberg.com
Yahoo Finance
Google Finance
MarketWatch.com
TheStreet.com
Financial Times
Wall Street Journal
Investor's Business Daily
Forbes Breaking News
AP Breaking News at BusinessWeek
AG Edwards Market Monitor
Fidelity Markets & Sectors
Weekley - Monthly News:
Money Magazine at money.cnn
Barrons
Business Week
Forbes
Investement Guidance:
Motley Fool
Blogs:
Seeking Alpha
Bill Cara
CXO Advisory Group - Steve LeCompte
Random Roger's Big Picture
The Kirk Report
2005 Best Financial BLogs at CNN Money
BobKronish.blogspot.com/

Other:
U.S. Securities and Exchange Commission
http://www.cnbc.com/ and Squawk Box
MSN Money
StockCharts.com
ChartsRus.com
BigCharts.com
The Investement FAQ
Option Pricing Model
StockMaster
The Market Oracle

Where to get good advice:
The TV market news sites above,CNBC, Bloomberg, ... give you both sides of the story so you have to figure out for yourself who is right. The guys at our computer investing group say they turn the sound off and watch these only to get current movement.

A report in the June 25, 2007 Wall Streeet Journal shows that Economist's consensus forecasts aren't that accurate. You expect more volatility in the actual results since the forecasts are averaged across multiple analysts, but the forecasts were right in the direction of change only half the time.

The QXO Advisory Group (Steve LeCompte) tabulates the market forecasts of 42 major market commentators and forecasters. The top forecasters as of June, 2007 were Ken Fisher in Forbes, David Nassar, Louis Navellier and James Oberweis at MarketWatch.com and Jack Schannep at zacks.com, and Jason kelly at JasonKelly.com with 60-72% accuracy. Only 18 were better than 50% and 24 were accurate only half or less of the time.

The Hulbert Financial Digest (HFD) tracks the performance of over 180 investment newsletters.

Jim Cramer's Mad Money picks can move a stock up in the short run, but according to CramerWatch.org, after 30 days he is right only 49% of the time.

Value Line is a service that ranks stocks from 1 to 5 for timeliness. They claim their recommendations beat the market, however the Value Line Fund, which uses the Value Line ranking system to direct its stock picks has churned out so-so performance numbers relative to other large-growth funds.
By 2000, Value Line's top picks had fallen below market returns for five straight years.
In each of the four calendar years from 2001 through 2004, Value Line's Group 5 stocks outperformed the Group 1 stocks, just the reverse of Value Line's expectation. These four years in a row constituted the longest sustained period since inception in which Value Line's ranking system didn't work. Common wisdom was if you bought just before a stock got upgraded to a 1 you would make money, but buying after it was a 1 wasn't that good.
In 2005, however, the ranking system righted itself according to HFD.

Mutual Funds:
MorningStar is the Leading provider of mutual fund research and ratings.
In a 1997 Forbes article reported that half the domestic equity no-load funds got a four- or five-star ranking. Only a quarter receive a one or two-star ranking. This bias in the Morningstar ranking system was discovered by Wharton professor Marshall Blume. He found that Morningstar doesn't grade domestic equity no-loads just against their peers. It puts them into a universe that also includes load funds and sector funds, which come out below average because of their sales commissions. Also a fund only required a 3 year history, which gives new funds an advantage. They point out that Hulbert Financial Digest which was tracking Moringstar performance found the rating had little value for predicting future performance.

An 2001 A.G. Edwards study illustrated the unpredictable nature of money manager performance.
They used Effron Enterprises money manager database comparing over 1,000 managers.
They ranked managers over a 5 year period and looked at how they faired in the next five years. They found little correlation. Results:
Quartile
in 1st 5 yrs.
Quartile in 2nd 5 years.
1st 2nd 3rd 4th
1st 30% 17% 16% 37%
2nd 23% 24% 27% 26%
They also ranked managers by how many years they were in the top half, and it was a normal distribution with the majority only being in the top half 5 out of 10 years and none consistently for 10 years. Only 4% ranked in the top quartile for more than 5 of the last 10 years.

Why don't Mutual Funds beat the market?
According to the Motley Fool's web site:
- "On the whole, the average mutual fund returns approximately 2% less per year to its shareholders than does the stock market in general."
- "Over time, because of their costs, approximately 80% of mutual funds will underperform the stock market's returns."

A Bernstein GLobal Wealth Management Report in 2003 says:
Over a 20 yr. horizion managed funds returned an average of 6.5% after taxes compared with 7.8% for index funds while the market was up an average of 9%.

According to the International Herald Tribune in 1995:
1991-1993 56-60% beat the S&P
But these figures don't mean that the active managers are significantly better at stock picking.Improved performance was caused by the higher weighting that most general equity funds have toward smaller companies. These performed better than blue-chip S&P's 500 stocks during the period covered.
1995 17% beat the S&P
An article in the Desert News stataes:
In 2005 U.S. diversified equity funds, had an average return of 7.2% vs 3.5% for theS&P according to mutual funds watcher Lipper.

Some reasons for underperformance:

  • Dilution. Mutual funds generally have such small holdings of so many different stocks that insanely great performance by a fund's top holdings still doesn't make much of a difference in a mutual fund's total performance.
  • Buried Costs. Many mutual funds specialize in burying their costs and in hiring salesmen who do not make those costs clear to their clients. For example they may pay higher than necessary for trades in order to get things like free research.
  • Since 1983 the number of funds has increased by 25% per year. There are not enough good managers to manage them.
  • Funds are forced to sell because of redemptions in a bear market driving down prices.
  • Fees hurt the funds.
  • Large funds have to invest in the largest, most liquid stocks.
  • Funds heavily rely on research from the same small universe of big borkerage firms.

The advantage is you get diversification with a small (<$100,000) portfolio. See:
Advantages and Disadvantages of Mutual Funds at fool.com
"Stop Waasting Your Wealth in Mutual Funds" by Don Wilkinson, 2005

What drives the markets:
Why does the market not react or react the opposite way you would expect to news (e.g. gas prices are going up, the trade deficit is up, ...). The TV analysts say the news was anticipated and already built into the markets.
Most of the short term movement is controlled by the institutional investors, market makers, floor traders, etc. The cynical types at the local investing group believe these investors have sophisticated models designed to fleece the individual investors.

I've heard that hedge funds account for 1/3 of the trading.
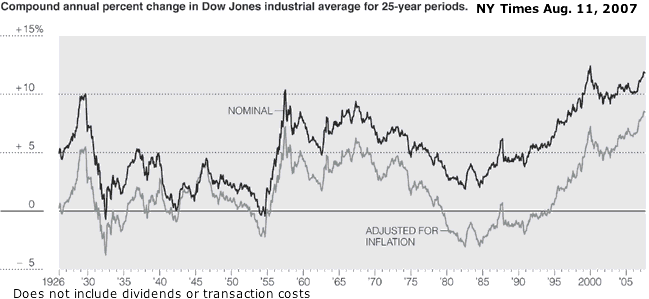
Logarithmic Charts
(Constant rate of increase is a straight line.)
The Dow Jones Industrial Average (DJIA) has been published since 1896. It is the average price of 30 of the largest and most widely held public companies in the United States. Many of the 30 modern components have little to do with heavy industry.
We use the S&P 500 (which has only existed since 1950) after 1950 because it is a broader market index.
When you look at a one or two year piece of the S&P chart below up close it looks very scary with periods of losses from 25% to almost 50%. However it demonstrates that in the long run these are little blips. No one has been able to consistently predict the time and size of these drops, so a long term strategy using one of the programs listed below will even out these blips.

Note: The indexes do not include dividends, which for the S&P average about 2%/year so your actual gain would be higher.
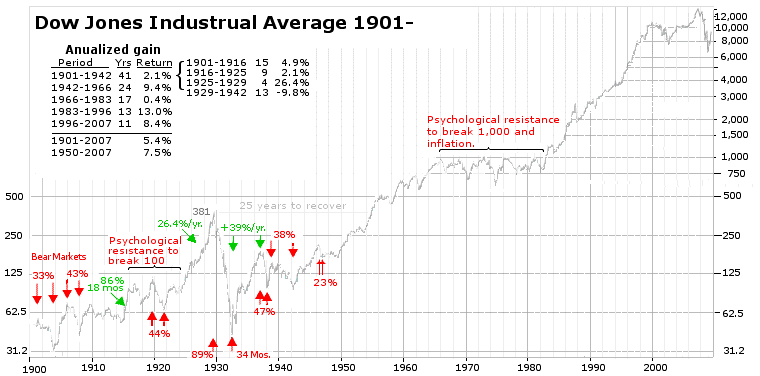
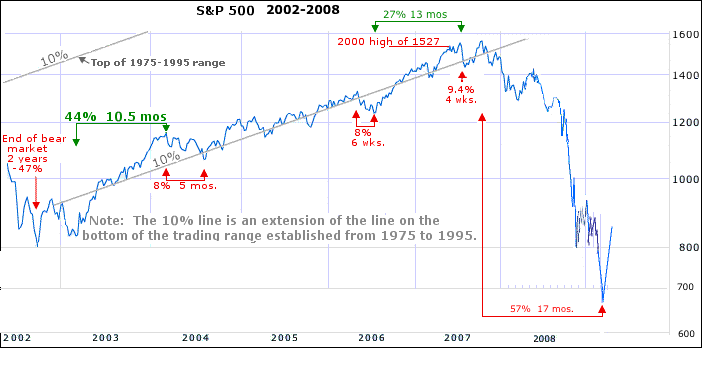
 DJI 1900-2007
See 1929 Crash
DJI 25 yr Av. Gain
25 years 7/31/1984 - 7/31/2009 8.4%

S&P 1950-2007

Bear Markets
From 1950-2008 there have been 6 bear markets (Drop of > 20% lasting more than 10 mos.)
Decline Years
abt. 20% 56-57, 61-62, 66
25-30% 81-82, 87
30-40% 70
>40 73-34, 2000-02, 2008
See Bear Markets and Recession

See Market Volitility

S&P 2003-2008

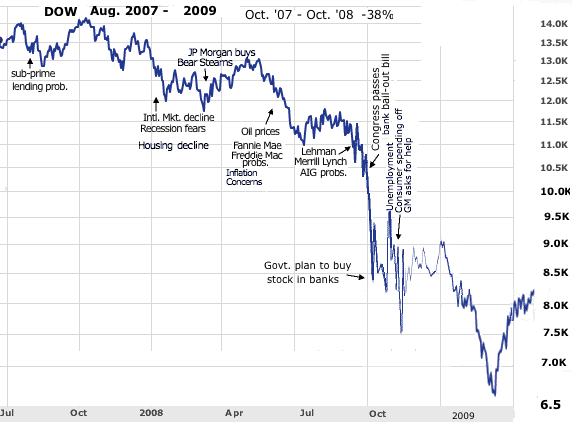
Sub-prime lending market problems in Sept. 2007, the longest profit slump in six years, the first nationwide decrease in home prices since the Great Depression, record oil prices and fears of a recession resulted the worst bear market in recent history.
- Aug. 15, 207 problems with financial institutions produced the largest single day point loss since 9/11 with a 504 pt. (4.4%) loss.

DOW 2007-2008

Over the weekend and on Monday, Sept. 15, 2008 Merrill Lynch, one of the biggest and best-known brokerage firms in the world, was sold to Bank of America for $50 billion due to financial difficulties stemming from problems in the mortgage markets. Lehman Brothers, unable to find a buyer, filed for bankruptcy . On Wed. the US Federal Reserve struck a deal to take control of AIG in return for an $85bn loan to stave off a collapse of the giant.

After congress passed a $700 B bail-out bill to help the financial credit crunch, credit markets remained frozen. The week of Oct. 6-10 was the worst week in history point wise when the Dow dropped 1,874 points or 18.2% 2nd worst percent loss since the 1929 depression.
DOW Sep 2008
weekly change

See 2008 Recession for more.


Big days (Since 1950):
DJIA: Largest Daily Loss      777  7.0%  Sept. 29, 2008
DJIA:  Daily Loss             685  7.1%  Sept. 17, 2001
DJIA:  Daily Loss             679  7.3%  Oct.   9, 2008
DJIA:  Daily Loss             618  5.7%  April 14, 2000
DJIA: Largest percent Loss        22.6%  October 19, 1987 (black Monday)
DJIA: Largest gain            936 11.1%  October 13, 2008 *
DJIA: 2nd Largest Daily Gain  889 10.9%  October 28, 2008
DJIA: 2nd Largest Daily Gain  499        March 16, 2000
DJIA: 3rd Largest % Gain      187 10.2%  Oct 21, 1987

* The 11 % gain in Oct., 2008 was bigest since Sept. 1932 (11.4%) or
March of 1933 (15.3%)  and the fourth-best overall.
See Bear Markets

NYSE Market Cap
Total $19.5 trillion stock funds $6.6T
hedge funds $1.7T *
* Not sure whether this is just NYSE or total. I've also seen a figure of over $2 T in hedge funds.

A 2007 article at cross-currents.net talks about how we have turned from investors to traders with the dollar trading volume (DTV) up 18% in 2007

Linear Charts are available on another page.

Other Indices:
S&P DJI Nasdaq 1995-2007
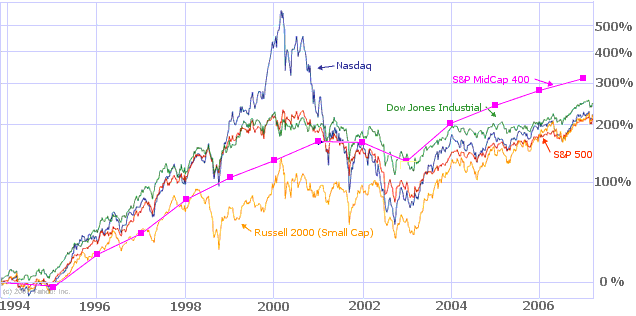
This chart demonstrates the volatility of Nasdaq relative to the other indexes.
The Dow Jones Industrial is the only major indicator (Dow, Nasdaq, S&P) which had recovered from the 2000-2002 bear market 4 1/2 years later (as of March 2007), as people moved to more defensive stocks.
(Note: It appears the numbers below do NOT include dividends)
Index 2003 2004 2005 2006
Russell 2000 (RUT) (SmallCap) 45.4% 17.0% 3.3% 17.0%
Amex composite 42.4% 22.1% 22.6% 16.7%
Dow Jones industrials (DJI) (Blue Chip) 25.3% 3.1% -0.6% 16.3%
DJ Wilshire 5000 29.4% 10.8% 4.6% 13.9%
Standard & Poor's 500 (GSPC) (Broad Market) 26.4% 9.0% 5.7% 10.7%
Standard & Poor's 500 (with dividends) 28.6% 11.0% 7.9% 12.5%
Dow Jones utilities 24.0% 25.5% 20.9% 12.8%
USA TODAY Internet 50 66.6% 8.8% 1.0% 11.4%
Nasdaq composite (IXIC) (Tech Stocks) 50.0% 8.6% 1.4% 9.5%
Nasdaq 100 (NDX) (largest in Nasdaq) 49.1% 10.4% 1.5% 6.8%
Standard & Poor's midcap 400 (MID) 34.0% 15.2% 11.3% 9.0%
Dow Jones transports 30.2% 26.3% 10.5% 8.7%
USA TODAY Internet/e-Business 25 57.5% 3.1% -14.6% 24.7%
USA TODAY Internet/e-Consumer 25 68.2% 25.5% 28.6% -4.4%
Source: 10 reasons an S&P 500 record can't be ruled out - USATODAY.com
See other indexes on the asset allocation page

See: A Fool's Guide to Indexes

Other Indexes:
Reuters CRB Index - Commodity Research Bureau CCI - Continuous Commodity Indexes

Relative performance of Bond funds and International:

MSCI EAFE Index of international equity performance.
Lehman Aggregate Bond Index (AGG) covers the investment-grade, fixed-rate, taxable bond market.
Merrill Lynch High Yield Master II Index of high yield Corporate bonds.

See indexes on the asset allocation page
10 Year (See also 15 year chart)
Stock and Bond relative perfromance 1996 2007
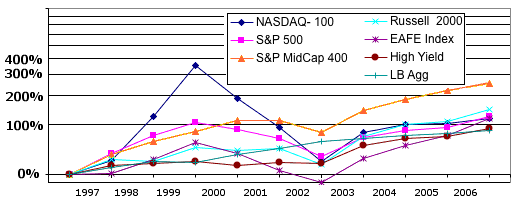
S&P 500 - Widely regarded as the best single gauge of the U.S. equities market, it includes a representative sample of 500 leading companies in leading industries of the U.S. economy, and focuses on the large-cap segment of the market. The median capitalization size of companies in the S&P 500 is approximately $13.2 billion.*

Nasdaq 100 Index - 100 of the largest domestic and international non-financial securities listed on The Nasdaq Stock Market, based on market capitalization. The index reflects companies across major industry groups including computer hardware and software, telecommunications, retail/wholesale trade and biotechnology.

The S&P MidCap 400 is the most widely used index for mid-sized companies (mid-caps). Today mid-caps are being recognized as an independent asset class, with risk/reward profiles that differ considerably from both large-ca ps and small-caps. The median capitalization of the S&P 400 companies is $2.7 billion.

The Russel 2000® small-cap Index - Measures is the standard small cap index. It includes the 2,000 smallest companies in the Russell 3000 Index. The index is completely reconstituted annually to ensure larger stocks do not distort the perfor mance and characteristics of the tr ue small-cap opportunity set. The median market capitalization of the Russell 2000 Index is $657 million.* 4Q 2006
Index Median Market Cap P/E
S&P 500 $13.2B
NASDAQ- 100 $9.6B 29.7
S&P MidCap 400 $2.7B
Russell 2000 $657M

Risk - Volatility:
Small- and medium-capitalization companies tend to have limited liquidity and greater price volatility than large-capitalization companies. Investments in foreign securities involve greater volatility and political, economic and cur rency risks and differences in accounting methods. Investments in debt securities typically decrease in value when interest rates rise. This risk is usually greater for longer-term debt securities. Investments in lower-rated and non-rated securities present a greater risk of loss to principal and interest than higher-rated securities.

Standard Deviation is one measure of volitility
1955-2004
Class Simple
Return *
Compound
Return
Std Dev
σ
small-cap 15.8% 12.9% 20.1%
large-cap 12.5% 10.9% 14.6%
Corp Bonds 7.3% 6.8% 8.4%
T-bills [1] 5.3% 5.3% 0.8%
* Simple Return - average of yearly returns
Volitility reduces long term return
E.g. if you invest $100 and get 20% the 1st year ($120) and -10% the 2nd year ($108) your average return is 5% but the compounded return is 3.9% 5% compounded would give you $110.25

Alpha, Beta and Sharpe Ratio are other measures of volitility. See the Glossary page.

1. Risk in long term debt securities (bonds, T-bills) is higher because you are locked into a rate for a longer period of time and price will drop as interest rates go up.

Economic Indicators:
Average annual increase
60's 70's 80's 90's
Real GDP 4.4% 3.3% 3.1% 3.1%
Productivity 2.9% 2% 1.4% 1.9%
Employment 1.9% 2.4% 1.7% 1.3%
S&P 500% 6.6% -0.5% 12.9% 15.9%
Real Estate 6.5% 10.1% 11.1% 5.5%
Average level
Inflation 2.3% 7.1% 5.6% 3%
Unemployment 4.5% 6.2% 7.3% 5.8%
Source: GarethMorgan.com/the-forty-year-slide_347.html

See Macro Economics for some general ideas on economics.

Strategies:
There are a variety of investing strategies:
The greatest enemy of a good plan is the dream of a perfect plan.
von Clausewitz

Growth
Use fundamental analysis to determine a companies financial strength (earnings growth, market share, P/E [Price Earnings] ratio, etc), management, products, etc. and pick the strongest.
Value
Look for companies which are bargains (e.g. low P/E (Price Earnings) relative to group), but with strong fundamentals. e.g. Cyclical stocks that are at the low end of their business cycle.
One study showed that value stocks outperform growth stocks over long periods of time.
Asset Allocation
In a landmark study, "Determinants of Portfolio Performance," published in the Financial Analysts Journal (July-August 1986), Brinson, Hood, and Beebower examined the investment results of 91 very large pension funds to determine how and why their results differed.
They determined 94% was due to Investment Policy, 4% stock selection and 2% market timing.
Investment policy was defined as the average base commitment to three asset classes: stocks, bonds, and cash.
You allocated a percentage of your portfolio to each class and as the value of one class went up you rebalanced your portfolio moving assets from the class that went up to the lower priced class. (i.e. sell high, buy low).

Several subsequent studies have confirmed that over 90% of the return was due to asset allocation.
Classes have become more complex including things like international stocks, real estate and other investments.

See: Asset allocation

Technical Analysis
Analysis of price movements and trading volumes rather than Fundamental analysis. Technical analysts typically use charts produced by computer tools like Telechart at worden.com or stockcharts.com which calculate things like:
  • Moving averages: 50, 200, ... day moving average, simple (SMA), Exponental (EMA), Weighted, ...)
  • f Indicators: Bollinger Bands
  • Momentum Indicators: Stochastic, Relative Strength
  • Trend Indicators: Average Directional Index (ADX), Moving Average Convergence/Divergence (MACD)
  • Oscillators: Stochastic, McClellan, ADX,
  • Other: Acceleration Indicators, Fibonacci retracement levels, Elliot waves
  • Price patterns: trading channels, hockey stick, cup with handle, Head and Shoulder Formations, candlestick charts, etc.
  • Super Bowl Winners

Investor's Business Daily also computes several technical scores for stocks.
Although technical analysts fell out of favor as studies questioned their forecasting powers, increased access to information and the growing power of computers have led to a resurgent interest.
See: Technical Analysis

In the late 1970's Ficher Black of Goldman Sachs, Myron Scholes of Stanford and Robert Merton of Harvard figured out how to price and hedge bond options in a way that guaranteed profits. In 1997 Merton and Scholes won the Nobel price in economics for their work. Only a year later Long Term Capital Management, a highly leveraged hedge fund whose directors included the two Nobelists, collapsed and had to be bailed out to the tune of $3.6 billion by a group of banks.

Other styles:
Active (stock picking) vs Passive (invest in mutual funds or exchange traded funds)

Bottom-Up (company fundamentals) vs. Top-Down (economic and market sector analysis first)

Strategy Links:
Investment Styles at axaonline.com
Blog Synthesis: Individual Investing at QXO Advisory.
What's Ahead for Stocks and BondsÑAnd How to Earn Your Fair Share, by John C. Bogle Founder and Former Chairman, The Vanguard Group

Types of investements:
Investment in Mutual Funds: Billions
Year Mutual
Funds
Index
Funds
ETFs
1996 3,526 97 2
1998 5,525 264 16
2000 6,965 382 66
2002 6,390 325 102
2004 8,107 549 226
Management expenses * 1.3-2.5% 0.2-0.5%  
Examples
S&P 500   VFINX, FSMKX,
PREIX, SPFIX
SPDR (Spiders)
SPY
Nasdaq   FNCMX Cubes
QQQQ
Dow Jones Industrial   Diamonds
DIA
S&P SmallCap 600     IJR
Russell 2000     IWM
S&P GSCI Commodity-Indexed     GSG
* In addition to lower expense ratios Index funds do not have loads.
† SPDR (Standard & Poor's Depository Receipts) Symbol: SPY, the ETF tracking the S&P 500 index, is more commonly referred to as spider.
‡ IJR - iShares S&P SmallCap 600 Index

ETFs (Exchange Traded Funds) vs Index Funds.
Both are designed to match the price of a market index (e.g. the Dow Jones Industrial, S&P 500, etc.)
ETFs can be thought of as a mutual fund that trades like a stock. However, it is not a mutual fund, which has its value calculated at the end of the day; an ETF's price varies throughout the day like the index does. You can also short an ETF like a stock.
Shareholder transaction costs are usually zero for index funds, but this is not the case for ETFs.
ETF's have a creation/redemption in-kind feature of ETFs eliminates the need to sell securities, so minimizing capital gains taxes.
There are other differences like the way dividends are handled.
The bottom line is passive retail investors will usually be better off with Index funds and active traders will benefit from the qualitative advantages of ETFs.
See ETFs vs Index Funds at Investopedia.com.

A common statistic is that the S&P 500 outperforms 80% of mutual funds. While this stat is true in some years, it's not always the case.
Mutual funds have several disadvantages:
Because of the large amount of assets they can only take small positions in individual stocks and can't sell them at one time because they can't find buyers for such large blocks.
Cash float.

Inverse Funds:
In an expected market downturn instead of shorting stocks or an ETF (which requires margin accounts, and liquidity to cover margin calls), there are Inverse funds which will go up when a sector or index goes down. These can be used as hedges to avoid short term cap. gains by selling early or for a market strategy which calls for going short at times.
E.g.: Rydex Inverse S&P 500 Inv CL (RYURX) - Inverse of S&P 500
Fees: Transaction $75, Mgmt. 0.9%, Distribution fee 0.25%
Short Small Cap ProFund Inv CL (SHPIX) - Inverse of the daily performance of the Russell 2000 Index
Rydex Inverse Russell 2000 CL H (RYSHX) -

Categories:

The investment advisors who offer free lunches to retired people usually push equity indexed annuities (EIA) and Insurance. EIAs have a value tied to a stock index but an minimum return (usually around 3%) and a cap on gians, so they are attractive if you are worried about a stock market decline. However, there are usually caps, spreads, margains and crediting methods that can hinder returns and penalties if you cash in early e.g. less than 5 years. They usually have high comission rates also.
I don't know the pros and cons of these but the contracts are usually many pages with lots of terms and conditions. Some providers are: Allianz Life

Other Links:
Bull Markets and Bear Markets at LowRisk.com

Where to get good advice:

Sample commentaries:
What The Market Is Telling Us Volatility is back. Ominous signs loom. But the outlook for U.S. markets is surprisingly upbeat. Business Week Mar 12, 2007
Financial Sense "BULL MARKET CORRECTION OR BEAR MARKET?" - June 2006
Correction or the Beginning of an Imminent Crash? - MarketThoughts.com March 2004
Safehaven | Effects of 10-year Cycle Already Being Felt - April, 2004

See Macro Economics for Financial terms (GDP, CPI, ...)


Books:
The Only Three Questions that Count, 2006, Ken Fisher
Unconventional Success: A Fundamental Approach to Personal Investing by David Swenson. Review
The Number" by Lee Eisenberg
"The Rules of Risk" by Ron Dembo and Andrew Freeman
"All About Asset Allocation" by Richard Ferri
"More Than You Know" by Michael Mauboussin
"Ahead of the Curve" by Joseph Ellis

Glossary: See Glossary page.

Links:
Things to worry about. Concerns.
A Fool's Guide to Indexes
PathoInvesting.org

Asset Allocation
Technical Analysis
Futures Trading System Rankings
Money, Mutual FUnds, Stocks, Real Estate, ... at thisMatter.com
StockMarketTiming.com
LearningStockTrading.blogspot.com
invest-faq.com/
Dave Ahl's Basic Principles of Investing: A Down-to-Earth, No-Nonsense Approach


Return to Finance

Send comments and suggestions to
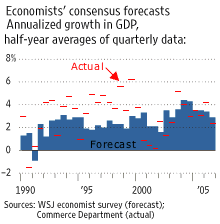
last updated 8 Aug 2009