| Go Home |
Click Topic for Easy Navigation
In another section of this site, we discussed the procedure for choosing the best investment based on risk and yield. That choice is controlled by two quantities - accumulation and DQPY (Down Quarters Per Year). However, putting all your money in that best investment is equivalent to the proverbial "putting all eggs in one basket".
A portfolio consists of several investments. The fraction of the total asset invested in each investment is the allocation in that investment. If you invest 25% of your asset in PPX, 40% in QQX, and 35% in RRX, then the allocations in PPX, QQX, and RRX are 0.25, 0.40, and 0.35, respectively. Denoting these allocations by FP, FQ, and FR, you would find that
Equation (1) means that the sum of the allocations gives the whole portfolio or "one". In general, if you have N number of investments with allocations of F1, F2,...,FN, then
If you know the average yields from each investment, then you can calculate the average yield of the portfolio. Say, the yields from PPX, QQX, and RRX are YP, YQ, and YR, respectively. Then, the average yield Y of the portfolio is given by
In general, for N number of investments with yields of Y1, Y2,...,YN
| The net yield from the portfolio is the sum of the yields from each fund in the portfolio. For each fund, calculate the product FIYI, where FI is the fraction of asset in the I-th fund and YI is the average yield from the I-th fund. |
To calculate risk, you need to calculate two statistical quantities - variance and co-variance. The procedure for calculating these quantities by using Excel is given later in this page.
Variance is a measure of the fluctuation in the yield of an investment. For PPX, QQX, and RRX, we will denote the variances by VP, VQ, and VR
Co-variance is a coupling between the fluctuations in the yields of two investments. For PPX, QQX, and RRX, we can calculate three such couplings. These couplings are denoted by CPQ, CPR, and CQR. Note the double subscript of C that identify the coupling.
The variance V of the portfolio can now be written as
In general, for a portfolio with N investments, the variances are denoted by V1, V2,...,VN, and the covariances by C12, C13,...,CIJ,...,CN-1,N
Then the variance of the portfolio is
| The variance expression for the portfolio contains two kinds of terms - contribution from each fund in the portfolio and the contribution from the coupling among the funds in the portfolio. The contribution from each fund has the general form F2V (F-squared times V), where F is the fraction of asset in a fund and V is the funds variance. If you have eight funds, then you will have eight terms of this type. You can identify each term by a subscript 1, 2,..., 8 where the funds are numbered one through eight. There are numerous coupling terms, because each fund interacts with (or "shakes hand" with) all the other funds. If you have three funds, then there are three "shake hands": 1-2, 1-3, and 2-3, and there are three interaction terms. If you have five funds, then there are ten "shake hands": 1-2 1-3 1-4 1-5 2-3 2-4 2-5 3-4 3-5 4-5, and there are ten interaction terms. Each "shake hand" term has the following form 2FIFJCIJ, where FI and FJ are the fractions of asset in funds numbered I and J, and CIJ is the covariance among I and J. After obtaining all the individual terms and the "shake hand" terms, just add them up to obtain the variance of the portfolio. |
As discussed in the page on Risk and Yield, the risk is the square-root of the variance.
In a portfolio with N number of investments, the allocations F1, F2,...,FN, the yield Y, and the variance V are related through the equations (2), (4), and (6). The purpose of optimization is to minimize V for a given Y by suitably choosing the allocations. The problem statement for the optimization reads as follows: For a given yield Y = Y0, find F1, F2,...,FN such that V is minimized. If you are not allowed to "short" any of the investments, then you must do a constrained optimization. The constraints are:
This constrained optimization problem can be conveniently solved by using Excel. The procedure for Excel is demonstrated later in this page.
For now, we leave the abstract mathematics and focus on a concrete example.
Consider three investments with tickers AAA, BBB, and ZZZ. In Table I, the annual yields from these three investments are shown over a five-year period.
| Investment | 1995 | 1996 | 1997 | 1998 | 1999 |
|---|---|---|---|---|---|
| AAA | 24.6 | 9.20 | 17.8 | 36.6 | -4.60 |
| BBB | 19.4 | 10.4 | 19.0 | 33.4 | -2.40 |
| ZZZ | 2.60 | 20.2 | 32.2 | 3.1 | 21.0 |
In Table II, the average yield, risk, expected growth of $1 over a one year period, and the DQPY are shown.
| Investment | Average Yield | Risk | Accumulation | DQPY |
|---|---|---|---|---|
| AAA | 16.72 | 15.57 | 1.155 | 0.57 |
| BBB | 15.96 | 13.16 | 1.152 | 0.45 |
| ZZZ | 15.82 | 12.76 | 1.151 | 0.43 |
Obviously, AAA is the best investment, because it has the largest accumulation potential. Although the first impulse is to put all our money in AAA, but the reality dictates that, a mixture of AAA and ZZZ gives us a better portfolio than AAA alone. This mixing of investments is diversification.
We now explore the reason behind the advantage of mixing investments. In the plot below, the variations of yield with time for AAA, BBB, ZZZ are shown.
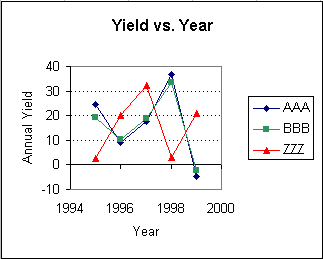
This plot shows that, the yields of AAA and BBB are in phase, i.e., the yields of AAA and BBB go up and down together. Whereas, the yield of ZZZ is out of phase with the yields of AAA and BBB, i.e. when ZZZ is up, AAA and BBB are down and vise versa. In mathematical terms, ZZZ has a negative covariance with AAA and BBB. Whereas, AAA and BBB have a positive covariance among themselves.
In the market place, you will find many pairs of investments with negative covariance; examples are: value and growth, domestic and international, small-cap and large-cap, European stocks and Asian stocks, etc. It is not necessary that this negative covariance persists continually. Even occasional negative covariance is good enough reason for diversification, as will be shown below. Intuitively, mixing two out-of-phase investments makes sense, because when one is not making money the other is.
| This is how we calculate the covariance of two investments by using Excel on Mac or PC. Say, you have entered 10-year yields of AAA in cells A1 through A10 and those for BBB in cells B1 through B10. In cell C1, enter =covar(A1:A10,B1:B10) |
Two other quantities you need for the diversification calculation are: the variances and the average yields of AAA, BBB, and ZZZ. You may recall that the variance is the square of the risk (SD)
| To calculate the variance and the average yield of an investment by using Excel on Mac or PC - enter 10-year yields in cells A1 through A10. For variance calculation, enter =var(A1:A10) in a cell and for average yield calculation, enter =average(A1:A10) in another cell. |
Go to the Top
Consider a portfolio with 40% of the capital invested in AAA, 35% in BBB, and 25% in ZZZ. The fractions 0.40, 0.35, and 0.25 are the allocations in the three investments. We denote the allocations in AAA, BBB, and ZZZ by FA, FB, and FZ, respectively.
The purpose of asset allocation is a diversification of asset. Asset allocation increases the rate of growth of your capital by minimizing risk. Through asset allocation, an investor makes up the loss (or low yield) in one investment, over certain periods of time, by the better gain in another investment.
Index investing is a diversification strategy of investing in a large number of stocks. There are many standard index investing tools available in the market, such as DOW 30 (30 stocks), S&P 500 (500 stocks), Russell 2000, and Willshire 5000. The allocation of capital in each stock in these Indices is based upon the size of the company. However, this allocation may not be right for you.
Diversification is only one part of asset allocation. Diversification reduces risk, but asset allocation minimizes risk for a given yield. In that sense, an asset allocated portfolio is optimized. As will be shown below, the best reduced risk portfolios are constructed by mixing investments that have negative covariance among them.
Absolutely not. The optimization depends on need. For example, a young investor seeks growth of capital and not income; whereas, a retiree may pay more attention toward income. Need-based optimization is a more difficult problem and will be addressed in a future section.
In Table II, we calculated the expected accumulations if we invest in only one of the three choices: AAA or BBB or ZZZ. Now, we would examine the effect of mixing investments in a portfolio. Let us consider two portfolios:
If we put all our money in AAA (FA=1, FB=0), then from Table II, our expected yield is 16.72% and risk is 15.57%. On the other hand, if we put all our money in BBB (FA=0, FB=1) then from Table II, our expected yield is 15.96% and risk is 13.16%. Thus, the expected yield of Portfolio-AB is bounded by 16.72% at the top and 15.96% at the bottom. All mixtures of AAA and BBB give average yields within this range of the expected yield. Any such mixture would be beneficial to us only if we can reduce the risk.
In mathematical terms, we solve an optimization problem. The procedure for optimization is as follows:
We can pick various yield values in Step 1 and run the optimizer of Step 2 for each of these yields. The results of such an exercise are shown in Table III. The quantity YAB is the yield of AB-Portfolio.
The optimizer is available within the Excel software in your computer. I will show you how to run the optimizer and I will give you the mathematical details of the optimizer, later in this page. For the time being, let us examine Table III.
| Yield YAB | Allocation in AAA | Allocation in BBB | Minimized Risk | Accumulation | DQPY |
|---|---|---|---|---|---|
| 16 | 20 | 80 | 13.13 | 1.152 | 0.45 |
| 16.1 | 31 | 69 | 13.24 | 1.153 | 0.45 |
| 16.2 | 42 | 58 | 13.42 | 1.154 | 0.45 |
| 16.3 | 53 | 47 | 13.69 | 1.154 | 0.47 |
| 16.4 | 64 | 36 | 14.03 | 1.155 | 0.48 |
| 16.5 | 76 | 24 | 14.44 | 1.155 | 0.51 |
| 16.6 | 87 | 13 | 14.92 | 1.155 | 0.53 |
| 16.7 | 98 | 2 | 15.45 | 1.155 | 0.56 |
Table III shows:
The outcome of this analysis is graphically shown in the following Figure. The plot shows a steep rise in risk for small increases in the yield.

Based on the values of accumulation and DQPY, the best possible allocation in the AB-Portfolio is 64% in AAA and 36% in BBB. The accumulation value is 1.155 and DQPY value is 0.48.
An important observation: When you mix two investments that are in positive covariance (such as AAA and BBB), do not expect vastly improved performance from your portfolio. But, as will be shown below, when you mix investments that are in negative covariance (such as AAA and ZZZ), amazing results can be achieved through optimization.
If we put all our money in AAA (FA=1, FZ=0), then from Table II, our expected yield is 16.72% and risk is 15.57%. On the other hand, if we put all our money in ZZZ (FA=0, FZ=1) then from Table II, our expected yield is 15.82% and risk is 12.76%. Thus, the expected yield of Portfolio-AZ is bounded by 16.72% at the top and 15.82% at the bottom. All mixtures of AAA and ZZZ give average yields within this range of the expected yield. Any such mixture would be beneficial to us only if we can reduce the risk.
The results of the optimization process for Portfolio-AZ are shown in Table IV. The quantity YAZ is the yield of AZ-Portfolio.
| Yield YAZ | Allocation in AAA | Allocation in ZZZ | Minimized Risk | Accumulation | DQPY |
|---|---|---|---|---|---|
| 15.9 | 9 | 91 | 11.02 | 1.154 | 0.30 |
| 16 | 20 | 80 | 9.11 | 1.156 | 0.16 |
| 16.1 | 31 | 69 | 7.70 | 1.158 | 0.073 |
| 16.2 | 42 | 58 | 7.10 | 1.160 | 0.045 |
| 16.3 | 53 | 47 | 7.50 | 1.161 | 0.060 |
| 16.4 | 64 | 36 | 8.77 | 1.161 | 0.12 |
| 16.5 | 76 | 24 | 10.60 | 1.160 | 0.24 |
| 16.6 | 87 | 13 | 12.75 | 1.159 | 0.39 |
| 16.7 | 98 | 2 | 15.09 | 1.156 | 0.54 |
Table IV shows:
The outcome of this analysis is graphically shown in the following Figure. Note the decreasing risk with increasing yield at the beginning. After risk hits a minimum, risk and yield rise together. The bullet shaped risk-yield curve for optimized portfolios is called the efficient frontier.
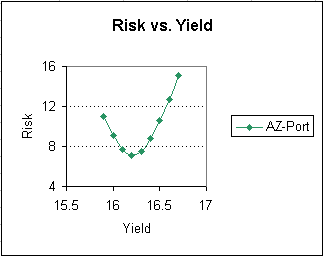
Based on the values of accumulation and DQPY, the best possible allocation in the AZ-Portfolio is 53% in AAA and 47% in ZZZ. The accumulation value is 1.161 and DQPY is 0.06.
We started with three choices of investment - AAA, BBB, ZZZ. First, we constructed a portfolio consisting of only one investment AAA. Second, we constructed portfolio AB and finally, we constructed Portfolio-AZ. The outcomes from these three choices are summarized in Table V, below. In constructing Table V, we have hypothesized the following situation: $20,000 is invested for a period of 10 years.
| Portfolio | Allocations | Value After 10 Years | Number of Down Quarters in 10 Years |
|---|---|---|---|
| AAA only | 100% in AAA | $84,499 | 6 |
| AB-Portfolio | 64% in AAA, 36% in BBB | $84,499 | 5 |
| AZ-Portfolio | 53% in AAA, 47% in ZZZ | $88,992 | 1 |
Comments: (i)The portfolio containing 100% AAA is the worst. (ii) Combining AAA and BBB provides some advantage as the number of "down quarters" is reduced. However, we do not gain anything in accumulation. This was somewhat expected as AAA and BBB have positive covariance. (iii) Combining AAA and ZZZ provides astonishing results. The accumulation goes up by $4500 and at the same time the number of "down quarters" goes down to 1. This shows that an optimized mixture of two investments in negative covariance leads to higher accumulation and lower risk. Asset allocation benefits the investor in two ways - higher gains and lower probability of loss of capital.
In order to write the mathematical equations for Asset Allocation among investments, we need to introduce some symbols.
In Table V, the values of all of these quantities are given.
| Quantity | Value |
|---|---|
| YA | 16.72 |
| YB | 15.96 |
| YZ | 15.82 |
| VA | 242.4 |
| VB | 173.3 |
| VZ | 162.7 |
| CAB | 162.1 |
| CAZ | -96.55 |
| CBZ | -67.40 |
In the AAA and BBB portfolio, the fractions of assets in AAA and BBB are FA and FB, respectively. The variance (risk squared) of the portfolio, VAB, is given by
Our goal is to minimize the variance, VAB, for the portfolio under certain conditions. The conditions are:
FA + FB = 1 . . . Equation (9)
(meaning AAA and BBB put together gives the whole portfolio)
YAB = FA YA + FB YB . . . Equation (10)
(meaning the yield of the portfolio is a combination of the yields of AAA and BBB)
FA >= 0 and FB >= 0 . . . Equation (11)
(meaning you cannot short AAA or BBB)
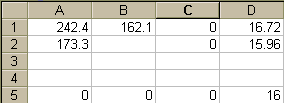
After these eight steps, the Excel sheet will look like the Figure below. The demanded yield of 16% is entered in cell D5.
At the completion of these steps, the pop-up window will appear as shown in Figure below.
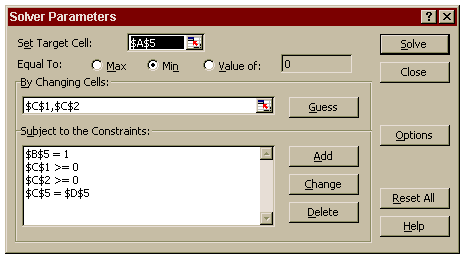
Now, click the "Solve" button. The optimized allocations for AAA and BBB will appear in cells C1 and C2. Repeat the calculation after entering a new desired yield in cell D5.
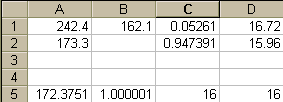
The following Figure shows the Excel screen after the solver has found the optimum allocation. In this Figure, the demanded yield of 16% is in cell D5, the optimized yield of 16% is in cell C5, the optimum allocations appear in cells C1 and C2, and the minimized variance of 172.4 appear in cell A5.
