| Go Home |
Two quantities that determine the quality of an investment are risk and yield. The yield is given in percentage and it determines the rate at which an investment grows over time. For most investments, the yield does not remain constant over a time period; instead, depends on a number of factors: state of the economy, consumer sentiment, improved technology, new materials, new management, inventions, natural catastrophes, political disturbance, cost of production, etc. These factors cause fluctuations in the yield. Such fluctuations could be daily, monthly, quarterly, or yearly. A measure of the fluctuation in yield is risk.
Average yield and risk can be calculated for any investment, such as stocks, bonds, and mutual funds. However, if you want to calculate yield and risk from the daily fluctuations of price or yield, you will need to do massive amount of calculations, everyday. Such calculation is neither practical nor useful. Moreover, investors do not buy stocks and bonds based on risk and yield calculations. The strategy for stocks and bond buying is completely different. The yield-risk calculation is extremely useful in dealing with mutual funds. You should never buy mutual funds without a yield-risk analysis. In the rest of this page, the concepts of average yield and risk are discussed in the context of mutual funds or a portfolio composed of various securities.
The assessment of the quality of an investment must begin with the calculation of the average yield and risk. If you have access to the Morningstar Mutual Fund Guide (search in your local Public Library), then you can obtain the average yield and risk (standard deviation) for your mutual fund. Otherwise, you can use the following calculator to obtain this data. Get the annual yields from your fund for the last five years from the Annual Report of your mutual fund (the Annual Report usually provide this historical information). Type in the annual yields from your mutual fund in the boxes and click the "Calculate" button.
In Part-II of this page, the detailed mathematics behind this calculation is discussed.
The growth of your money in an investment depends, in a complex way, on the average yield and risk. One important fact to remember is that, for the same yield, lower risk investments lead to larger accumulation of wealth.
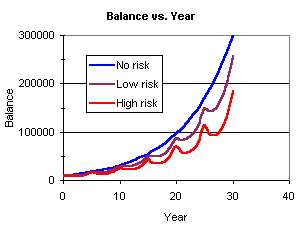
In the following Figure, the growth of $10,000 in three investments over a period of 30 years is shown. For all of these investments, the average yield is 12%. The figure shows that, the amount of final balance, at the end of 30 years, reduces significantly as the risk increases. Larger risk means that there are longer periods of time during which the value of your investment drops due to larger losses in the investment.

If I tell you that a particular investment has an average yield of 18% and a risk of 12%, it means very little to you. However, the information - "$1000 invested in this investment is expected to grow to $4757 in 10 years and you are expected to lose money during 3 quarters (a three month long period) in these 10 years" - is very pertinent and easy to understand. The final balance, at the end of the period of investment, will be called the "accumulation" and the quarters during which you lose money will be called "down quarters".
The following calculator is provided for the you to examine the accumulation over a period of time and the number of down quarters you would experience over that period of time. Type in the amount and period (in number of years) of your investment. Also enter the historic return from your investment. The calculator takes into account the risk, average yield, statistical probability of loss and gain quarters, and compounding. The output are your final balance or the "accumulation" and also the number of "down quarters", over the period of your investment.
Ideally, you would like to have high accumulation and low number of down quarters. If two investments have comparable number of down quarters, then pick the one with the higher accumulation. Similarly, if two investments have comparable accumulation, then pick the one with the lower number of down quarters. When your pursuit of a higher accumulation forces you to accept a higher number of down quarters, you should ask yourself some critical questions: What is your risk tolerance? Do you have the mental strength to accept and survive a temporary loss? What effects the loss quarters will have on your mental and physical health?
You can also calculate the risk, return, accumulation, and DQPY for an entire portfolio. The mathematics of this calculation is somewhat involved and is described in detail in the section named Diversification and Asset Allocation, of this web site. You can use the following calculator to analyze the accumulation and DQPY of your portfolio.
Begin with the easy constant yield case. If $1 earns Y% over n number of years, then the balance at the end of n years is:
We have divided Y by 100, because Y is in %. As an example, if you invest $1 with an yield of 12% for 5 years, the balance at the end of the period is
The variable yield case is a simple extension of this math where Y changes from year to year. Imagine our $1 earns 2% for one year, 7% for one year, 12% for one year, 17% for one year, and 22% for one year. The balance at the end of 5 years is:
The first investment has a yield of 12% and the second one has an average (average of 2, 7, 12, 17, 22) yield of 12%. The first one is constant (zero risk ) yield and the second one is fluctuating (non-zero risk ) yield. The first one is obviously a better investment compared to the second one, because your $1 earns two extra cents in the first investment. However, for a $100,000 investment over 20 years, the first risk-free investment will earn $42876 more compared to the risky second investment!!
This calculation is a simple matter if you have the yield values over a time period. For mutual funds, you can easily get this data from the Annual Report of your fund.
If you have N quantities Y1, Y2, Y3,...,YN then
In the following Table, see the annual and average yield of four mutual funds.
| Fund | 1988 | 1989 | 1990 | 1991 | 1992 | 1993 | 1994 | 1995 | 1996 | 1997 | Average |
|---|---|---|---|---|---|---|---|---|---|---|---|
| Vanguard Index 500 | 16.2 | 31.4 | -3.33 | 30.2 | 7.42 | 9.89 | 1.18 | 37.5 | 22.9 | 33.2 | 18.7 |
| Janus 20 | 19.1 | 50.9 | 0.59 | 69.2 | 1.97 | 3.43 | -6.73 | 36.2 | 27.9 | 29.7 | 23.2 |
| Vanguard Muni. Long Term | 12.8 | 10.6 | 7.04 | 12.5 | 9.17 | 13.1 | -5.59 | 18.6 | 4.02 | 8.65 | 9.09 |
| Vanguard Muni. Short Term | 5.61 | 7.08 | 6.57 | 7.2 | 4.71 | 3.82 | 1.63 | 5.99 | 3.69 | 4.07 | 5.04 |
Calculation of risk is a five-step process. Consider three yield values: 4%, 11%, 28%.
We will call SD the risk of the investment.
In Table II, the average yield and risk are given for the four mutual funds.
| Fund | Average | Risk |
|---|---|---|
| Vanguard Index 500 | 18.65 | 14.44 |
| Janus 20 | 23.22 | 24.45 |
| Vanguard Muni. Long Term | 9.09 | 6.49 |
| Vanguard Muni. Short Term | 5.04 | 1.78 |
| The average-yield and risk can easily be calculated by using Excel. Enter the annual yields of your investment for the last five years in cells A1 through A5. To calculate average-yield in cell B1, enter =average(A1:A5). To calculate risk in cell B2, enter =sqrt(var(A1:A5)). |
As stated before, the yield of an investment is influenced by many random factors. According to statisticians, the outcomes that are influenced by random events can be represented by a mathematical model called the "normal distribution". We will not discuss the mathematical analysis, but will elaborate the outcomes of such analysis.
Consider an investment with an average yield Y and risk R. We now construct three ranges (or bands) from Y and R as follows.
Let us assume that for the investment ZZZX, Y is 10% and R is 4%. For this investment, the ranges are:
You may notice that the ranges can be arranged as follows:
It is known from the theories of statistics that, for any investment, the actual yield will lie within the "Low Range" 14% of the time; within the "Central range" 68% of the time; within the "High Range" 14% of the time. Thus, if you invest in ZZZX for a period of 10 years, the yield will be between 6% and 14% for 6.8 years (68%); between 14% and 18% for 1.4 years (14%); between 2% and 6% for 1.4 years. This conclusion is summarized in Table III.
| Yield between 2% and 6% | Yield between 6% and 14% | Yield between 14% and 18% |
| 1.4 years | 6.8 years | 1.4 years |
Before proceeding with the consequence of this observation, let us examine the validity of this theory in some real investments.
In Table IV, we have calculated the "Central Range" for the four sample mutual funds. We expect the yield to lie within the "Central Range" given in the second column for 6.8 years out of 10 years. In the last column, the actual number of years for which the yield was within the range is given.
| Fund | Range of Yield | Expected Number of Years | Actual Number of Years |
|---|---|---|---|
| Vanguard Index 500 | 4.21 to 33.09 | 6.8 years | 1988,1989,1991,1992,1993,1996 |
| Janus 20 | -1.23 to 47.67 | 6.8 years | 1988,1990,1992,1993,1995,1996,1997 |
| Vanguard Muni. Long Term | 2.60 to 15.58 | 6.8 years | 1988,1989,1990,1991,1992,1993,1995,1996 |
| Vanguard Muni. Short Term | 3.26 to 6.82 | 6.8 years | 1988,1990,1992,1993,1995,1996,1997 |
As we see in Table IV that, instead of expected 6.8 years, two funds gave 7 years, one fund gave 6 years, and one fund gave 8 years. We would consider such matching as acceptable in this statistical analysis.
The data of Table III, for the investment in ZZZX, are graphically shown in the figure below.

We can utilize the data of Table III to get a crude estimate of the growth of $1 invested in ZZZX for a period of 10 years. This growth calculation is shown in Table V.
| Range of Yield | Average Yield | Duration | Growth |
|---|---|---|---|
| 2% to 6% | (2+6)/2=4% | 1.4 years | (1 + (4/100))1.4 |
| 6% to 14% | (6+14)/2=10% | 6.8 years | (1 + (10/100))6.8 |
| 14% to 18% | (14+18)/2=16% | 1.4 years | (1 + (16/100))1.4 |
Accumulation = (1.04) 1.4 (1.1) 6.8 (1.16) 1.4 = $2.49
This expression has three terms, because we partitioned all possible yields into three broad bands. We had to take the product of the three terms to account for the compounding of growth. In each term, corresponding to one band, the average yield of the band is taken. The exponent of each term is the duration of the actual yield lying within the band. The algebraic expression for the accumulation can then be written as
.Where, An is the average yield of a band and Pn is the duration of the yield lying within the band.
In this calculation, we had broken the entire range of yield into three intervals: 2% to 6%, 6% to 14%, and 14% to 18%. Instead of only three intervals, we may choose to slice the entire range of yield into larger number of thinner intervals. The two figures below show the effect of increasing the number of intervals.
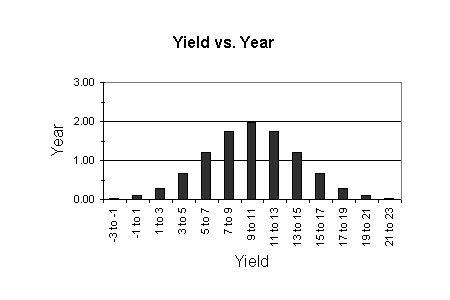
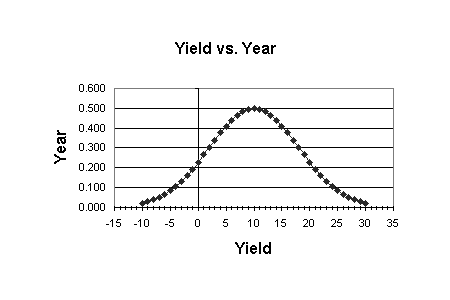
These figures show that, as the number of intervals is increased, the yield-probability distribution begins to look more like the familiar bell curve for normal distribution. As more details are revealed with increasing the number of intervals, we find that the tail of the yield-probability curve extends to negative yield values. This signifies that we will lose money on some occasions in our investment in ZZZX.
We can do the calculation, similar to the one shown in Table V, to obtain the value of the accumulation. When the bell shaped curve is partitioned into N slices, the formula for accumulation is
Recall that the calculation in Table V corresponds to N = 3.
| The probability Pn can easily be calculated by using Excel. For an investment with average yield of 15% and risk of 12%, the probability that the yield will lie within 18% and 19% =abs(normdist(19,15,12,TRUE) - normdist(18,15,12,TRUE)) |
Excel gives the probability of yield lying within a range over a one year period. To calculate the probability for T number of years, multiply the one-year probability by T.
The hand calculation becomes very tedious as the number of intervals is increased. The results of such calculation are presented, in an easy to use form, later in this page.
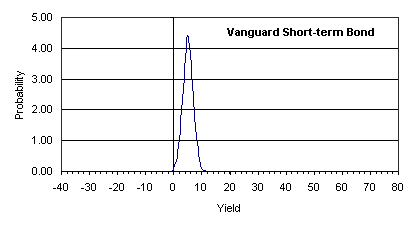
In the four figures below, I have presented the yield-probability curves for four mutual funds. All of these figures refer to a 20-year time-period.
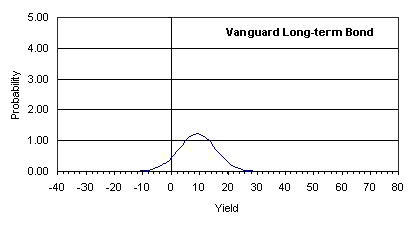
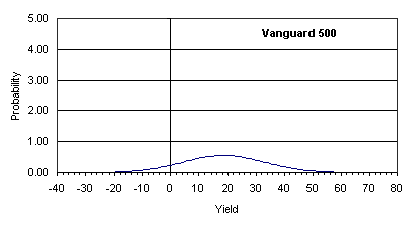
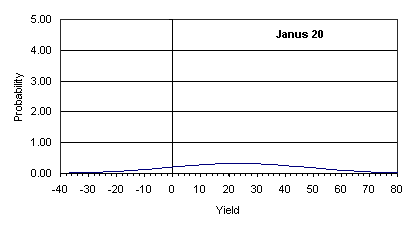
An investor's goal is to maximize accumulation over a pre-determined period of time. The length of this time period depends on when the investor intends to utilize the accumulated cash. With this goal of larger accumulation, an investor seeks higher yield. However, the ultimate question is - "How much risk can one take in the pursuit of higher yield?" The answer to this question depends on a complex combination of yield and risk. Instead of wading through a set of complex equations, an investor can estimate the accumulation at the end of a given period for a given yield-risk combination by utilizing the following formula.
The formula is developed for an investment over a period of one year. To calculate the accumulation at the end of the one year period, you need the risk and average yield of the investment. The risk (standard deviation) and the average yield can be calculated from the data in a fund's annual report or from Morningstar's Directory of Mutual Funds. Mathematically,
However, due to the effect of compounding, this function is quite difficult to determine. The two step process that I have used in this tutorial for determining an approximate function is: (i) Calculate the accumulation for a large set of yield-risk combination by using the theory of normal distribution and the method given in Equation (1). (ii) Fit a curved surface through the yield-risk-accumulation data by the method of regression. If we denote accumulation after 1-year by A, the average yield by Y, and risk by R, then
The formula shows that for a fixed yield, the accumulation value decreases as the risk increases. Also, for a constant risk, the accumulation increases as the average yield increases.
The accumulation values in this formula are extremely useful, because these values are computed by including the effects of average yield, risk, and compounding.
.Accumulation = 1 + 0.01 x 24 - 0.0009345 x 14 = 1.227
Accumulation = 1 + 0.01 x 35 - 0.0009345 x 28 = 1.324
Let us assume that we have two investment choices with the following characteristics:
Accumulation = 1.171
Accumulation = 1.197
The comparison of the two values of accumulation shows that Choice 2 is a better investment.
Accumulation = 1.204
Accumulation of $1 investment after 20 years = 1.204 20 = $40.98
Accumulation of $2500 investment after 20 years = 40.98 X 2500 = $102,450
Accumulation = 1.249
Accumulation of $1 investment after 30 years = 1.249 30 = $788.63
Accumulation of $1000 investment after 30 years = 788.63 X 1000 = $788,630
When the yield-probability curve extends into the negative side of the yield axis, we can expect a few quarters with loss from an investment. As the tail stretches more into the negative side of the yield axis, the probability of loss-years or loss quarters increases.
Long-term investors with a distant time-horizon can absorb more loss-years or loss-quarters compared to short-term investors or individuals who are close to retirement. Thus, the number of "Down Quarters Per Year" (DQPY) is an important factor to consider while making investment decisions.
If the average yield and risk of an investment are known, the bell shaped curve for the investment can be drawn, and from the extent of the negative tail of the curve, DQPY can be calculated.
In Table VI, the DQPY for four mutual funds are shown. Also shown are the expected (from a statistical analysis) number of "down quarters" over a 10-year period (1988 to 1997) and the actual number of "down quarters" from Morningstar.
| Fund | DQPY | Expected "down quarters" in 10-Years | Actual "down quarters" in 10-Years |
|---|---|---|---|
| Vanguard 500 | 0.393 | 10 x 0.393=4 | 4 |
| Janus 20 | 0.684 | 10 x 0.684=7 | 8 |
| Vanguard Long-term Bond | 0.322 | 10 x 0.322=3 | 3 |
| Vanguard Short-term Bond | 0.009 | 10 x 0.009=0 | 1 |
The data of Table VI show an acceptable agreement between the results from a statistical analysis and history.
| If you want to calculate the DQPY by using Excel, then type =abs(normdist(0,yield,risk,TRUE))*4 in one cell and hit "enter". For yield and risk, type in their corresponding values. The multiplication by 4 is necessary to convert the answer into number of quarters. For example, =abs(normdist(0,10,8,TRUE))*4 gives the DQPY for 10% yield and 8% risk. Don't worry about "TRUE", simply type it in!! |
I have done this calculation for various combinations of yield and risk. In the following color-coded Table, the DQPY values are given for various combinations of risk and average yield.

To use this Table, you need the average yield and the risk (standard deviation) of your investment. The risk and the average yield can be calculated from the data in a fund's Annual Report or can be found in Morningstar's Directory of Mutual Funds. To obtain the number of "Down Quarters Per Year" (DQPY), divide the yield by the risk to obtain Z. Then read the corresponding DQPY value.
The meaning of the color-coding in the "down quarters" is displayed in Table VII below.

After you have calculated the DQPY for your investment, you can calculate the number of quarters in which you will lose money in this investment. If you have a time horizon of N number of years, then the number of "loss quarters" is obtained by multiplying the DQPY by N .
For yield=24% and risk=14% we get Z = 24/14 = 1.7
For Z = 1.7, DQPY = 0.18
Over a 5 year period = 5 x 0.18 = 0.9 = 1 loss quarter
Over a 10 year period = 10 x 0.18 = 1.8 = 2 loss quarters
For 19% yield and 13% risk, Z = 19/13 = 1.5
For Z = 1.5, DQPY = 0.268
Over a 5 year period = 5 x 0.268 = 1.34 = 1 to 2 loss quarters
Over a 10 year period = 10 x 0.268 = 2.68 = 2 to 3 loss quarters
Average yield and standard deviation (risk) are wonderful statistical quantities that tell you the most probable yield from your investment and the magnitude of the fluctuations in the yield. Although these quantities have significant mathematical meaning and provide a solid foundation for analyzing the performance of an investment, but they do not directly answer several, straightforward, common questions you may have.
I have constructed the normal distribution of yield, from an investment over a long period of time, by combining the average yield and risk values. The probability of a specific yield can be obtained from this distribution. I have then combined this probability with the effect of compounding to calculate the expected, annualized return from the investment. This annualized return is called the accumulation A and can be determined by using Equation (1). As A contains the effects of yield, risk, and compounding, it is an extremely meaningful quantity that can be utilized to make long-term predictions. To my knowledge, this is the first time, in the literature on finance, the quantity "accumulation" has been calculated or utilized in evaluating the performances of investments.
If your initial investment is I, the accumulation value of the investment is A, and if the final balance is B after N number of years, then
A "loss quarter" is defined as the quarter in which your asset in an investment decreases due to a loss in the investment. Loss quarters naturally cause anxiety among investors. More importantly, a loss quarter just before you need your asset, to pay for a specific expense, could be catastrophic to your finances. The value of risk alone does not give you the probability of a loss quarter. Only after the normal distribution of yield is determined by combining the average yield and the risk, the probability of a loss quarter becomes apparent. I have calculated this probability as "down-quarters-per-year" (DQPY). To my knowledge, this is the first time, in the literature on finance, the quantity DQPY has been calculated or utilized in evaluating the performances of investments.
If DQPY is D, then over a period of N number of years, the expected number of loss quarters L is given by