| DOW THEORY |
Charles H. Dow published a stock market average in 1884 and it evolves into today's Dow Jones Industrial Average. He never write a book but his teachings are found in editorials of Wall Street Journal in the past. Although his ideas based on his market average and railway shares at his time, the theory still has application. I try to touch this large topics in several pages and give you basic idea. Reference is attached at bottom of this page.
Summarised his work, Dow Theory has six basic tenets. These tenets have very close connections with many other area of technical analysis especially the Wave Theory.
Lets look in greater details.
1. The average discounts everything
It stated everything affecting supply and demand of shares are reflected in average. The
average response is quick to any new information and discounts it in average movement. To
extend this understanding, expectation is also discounted, which forms expectation theory.
2. The market has three trends
The trends are classified by time frame. They are Primary, Secondary and Minor trend. Dow
used tide, waves and ripples of the sea to describe these three trends. Direction of a
tide is measured by the highest point of successive waves. Secondary trend, waves, serve
as corrections in primary trend with about half retracement. Minor trend, the ripples,
lasts less than three weeks and has shorter and smaller fluctuation than Secondary.
3. Major trends have three phases
The first phase is called accumulation, which represents informed buying by the most
astute investors. All previous bad news was discounted by the market and buyers re-enter
the market.
In second phase, most technical trend followers begin to participate, and prices advance quickly.
In the last phase, good news continuously comes out and speculative volume increases. Informed investors who began to accumulate at the bottom now distribute, when most of the other still hold or buy in.
Wave Theory has very similar description as it is developed from this. More will be discussed in Wave Theory section.
4. The averages must confirm each other
This is related to Dow’s time where there are two indices, Industrial and Rail Averages.
A bullish or bearish market is confirmed only when two averages give same signal.
5. Volume must confirm the trend
A signal given by averages must be confirmed by volume. Volume should expand in the
direction of the major trend. When trend goes up, volume should increase to confirm the
trend. When trend goes down, volume should decrease.
6. The trend is assumed to be in effect until it gives definite signals that
it has reversed
This is about timing of giving reversal signal. Definite signals mean the trend is
completed broken. Several illustrations help you to understand how Dow identifies a
reversal.
 |
 |
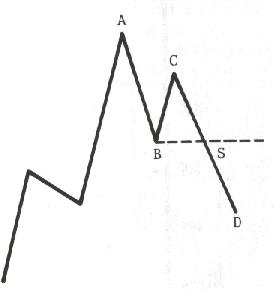
| As point C cannot go over A AND drop below B subsequently, it signals a sell at point S. |
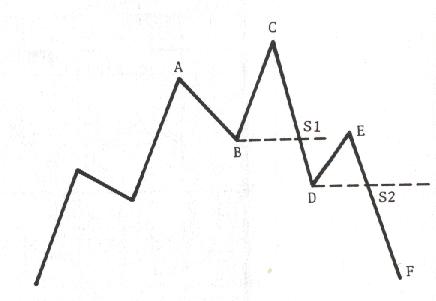
C goes higher than A but falls below B, some
Dow theorists may see a selling signal at S1. Some may consider the fall is confirmed after second drop through D.
|
 |
 |
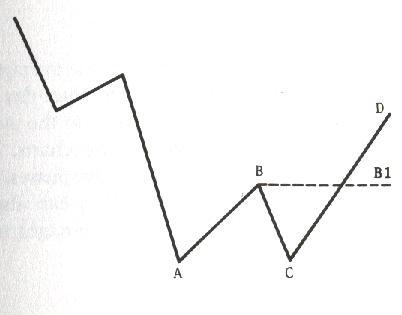
Buying signal at B1 after C overcome B, when A |
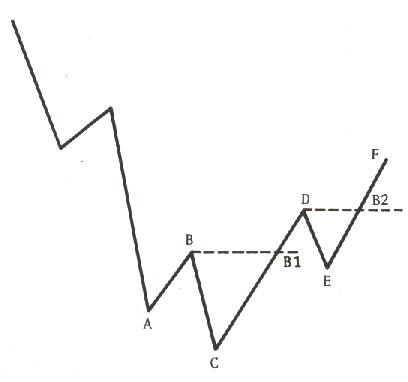
Conversely to the above, buying signal at |
This very brief introduction gives you a framework of adaptations of Dow Theory in various aspects of technical analysis. You will see more as you proceed.
Home | Technical | Fundamental | Links | Bookshelf
Egghead Investor Guide