Also known as the "Who Needs Mathematica?" Page
Return to the Raytracing Page
This page is going to be a little more abstract than the others. More mathematical images are on this page. Some of these images have information about their construction in the larger version (equations, etc.). All of the mathematical plots were created with a program I wrote.
Note I wrote a 3-D function graph INClude file compatible with POV-Ray versions 3.0 and above. It allows you to easily create and animate smooth or unsmoothed triangular meshes based on 3-D functions (in fact, it does almost everything for you). It makes it possible to create and animate smooth graphs like the Bell Curve and 3DWin Sine Curve below, while at the same time incorporating them into POV-Ray scenes. It can be downloaded off this page.
Note on equations: These may not be the real equations as they might be found in a textbook, but are modified either for typographical reasons or because that's the way I programmed them in. (I'm much more used to writing r := sin((3*a)/4) than r = sin¾a.) Exponents are usually defined with the carat symbol; e^(t*2) is equivalent to e2t.
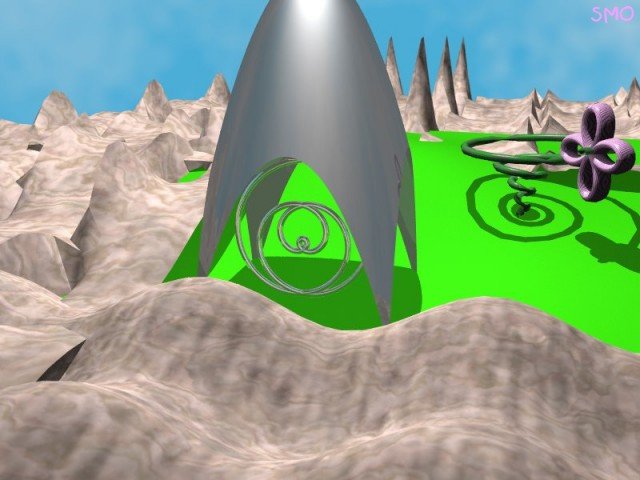
Math World All the objects in this image were created by my program. The mountains are made of sine and tangent function graphs, the tent-like thing is a partial sphere, and the others are 3-D curves. This (along with "Biosphere" on page 1) was submitted to the Internet Raytracing Competition. This image placed 22 spots lower than the other I submitted in the same round. If you want to hear what people think of this, click here for the comments. Unlike the other image, this one got its best marks in the Technical Merit category. And also unlike the other image, this one is really bad.
Möbius Strip This isn't mathematical (I drew it by hand), but I thought it fit in on this page more than the others.
Klein Bottle An open cylinder, one end of which is twisted around, brought to the inside and connected with the other end. It's related to the Möbius strip. This shows three views of it: two glass and one plastic.
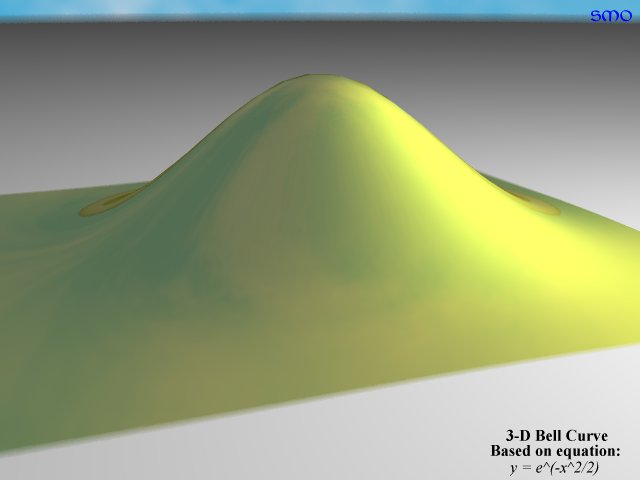
Bell Curve A 3-D bell "curve." Although the original curve is two-dimensional, I changed the equation to use the distance from the origin instead of the distance along the X axis to make a 3-D representation. The equation for the (original) bell curve is on the large image.
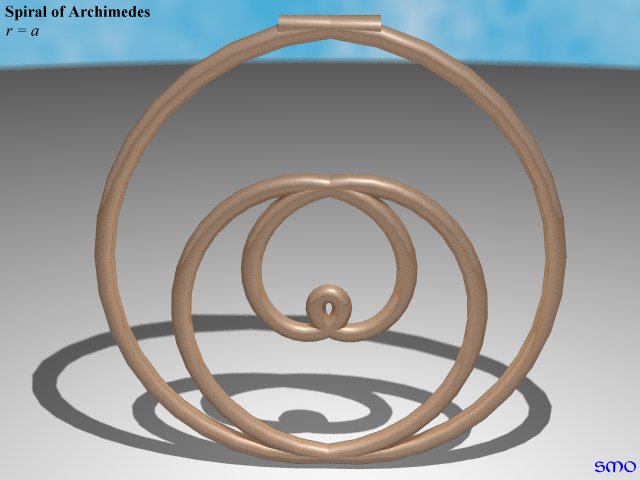
Spiral An odd spiral, made by mistake.
4 Plots Two different plots of a sine curve (one bargraph-type, the other with floating cubes), Fermat's spiral, and the cochleoid. The equation for Fermat's spiral is r = ±sqrt(a), so this really only has half the spiral... The equation of the cochleoid can be found on this page. Compare these square plots of the sine curve with the 3DWin - Sine Curve below. (And yes, this image is a little out of focus in the foreground!)
3DWin - Sine Curve This isn't a raytrace, but I thought this curve looked so weird when I was previewing it that I took a screenshot. I think it's a plot I made of a 3-D sine wave, slightly different from the one in 4 Plots because the sine isn't computed from the origin. This image shows the raw output of my plotting program before I stick the object into a scene for raytracing.
Fractals Interesting 3-D fractals; their names are listed on the image.
Spiral Curve Tornado-shaped 3-D curve. I'm working on the problem of there being a little dimpled cylinder wherever the curve crosses the Y axis. The equation for this curve is on the image.
"Roses" A couple polar curves made with (almost) the same equation.
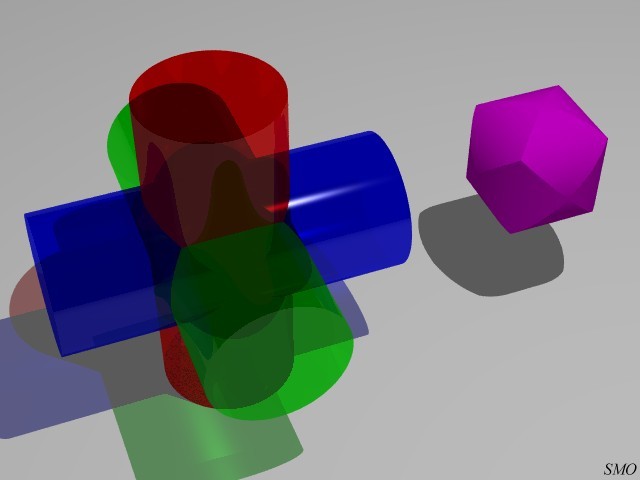
3 Cylinders Based on a problem which asks what shape is created when 3 cylinders intersect. Since one of the basic functions of the POV-Ray engine is that it lets you create more complex shapes from the intersection of simpler shapes, in this image I combined 3 glass cylinders on one side so you can see how the shape is created, and next to it I placed a rendering of the shape created where the cylinders come together.