
Vir Singh* and Tej Partap
International Centre for Integrated Mountain
Development (ICIMOD)
P.O. Box 3226, Kathmandu, Nepal
*Present address & address for correspondence:
Associate Professor and Incharge, Animal Science
G.B. Pant University of Agriculture &
Technology, Hill Campus
Ranichauri 249 199, Tehri Garhwal, India
INTRODUCTION
In the Himalayan mountains, draught animal power (DAP) is the only feasible source of energy for agricultural work. Large-scale substitution by fossil fuel-operated energy systems in this region is not only difficult but also inappropriate. Within the foreseeable future there is unlikely to be a viable alternative to DAP, and, therefore, it becomes an important consideration in sustainable mountain agriculture.
In subsistence mountain farming, productivity can only be improved through mixed farming involving DAP. Despite its potential contribution to agriculture, DAP, at least in the context of mountain farming systems in the Indian Central Himalaya, is one of the least explored fields. Nevertheless, study by Singh and Naik (1987) provides us with interesting information on this very important aspect of mountain agriculture; examining as they do the close links between DAP and productivity/ sustainability. Average yields and intensity of cropping are found to be influenced more by availability of power per unit area than by irrigation, fertilizer consumption, and use of high-yielding varieties (Srivastava and Yadav 1987).
This paper attempts to quantify (i) DAP output during different agricultural operations; (ii) DAP potential and balance; (iii) bullock work hours; and (iv) DAP contribution to crop cultivation in mountain agriculture. Animals’ energy contribution to raising different crops in mountain agriculture would help us understand and analyse links between DAP and mountain agriculture quantitatively, an exercise that might be useful in evolving techniques to increase production flows from the farming systems and enhance sustainability of mountain agriculture by manipulating animal power use in agriculture.
MATERIALS AND METHODS
The present study was conducted in 12 villages in four different farming systems, three villages in each, in the Indian Central Himalaya. The study sites were selected on the basis of stratified random sampling. The four Strata ( agro-ecological zones representing different farming systems) are as follows:
The terms ‘traditional’ and ‘transformed’ are only applicable to the Middle Himalaya. In the Shivalik range, a mix of traditional and transformed patterns and high degree of uniformity are evident almost everywhere. The farming system can be classified broadly as transitional. Greater Himalayan farming systems are also remarkably uniform. These are very traditional and almost primitive, more or less impervious to development interventions, unlike the systems at lower and mid-altitudes. On the contrary, villages in the Middle Himalaya are clearly distinguished; they are either traditional or transformed with respect to their farming systems. Transformation, nevertheless, is seldom complete. Some patches of land, especially those under rainfed conditions, are managed traditionally, even in transformed villages.
Since transformation of agriculture leads to changes in the use of energy, this criterion, obviously, would be of great help for the study of DAP issues. Three principal types of transformations in the farming systems of the Middle Himalaya are identified for study purposes: (i) transformation from foodgrain to vegetable-based cropping systems, (ii) transformation in terms of a genetic change in foodgrain crops followed by an alteration in cropping patterns, and (iii) transformation in terms of the development of an orchard-based farming system. From each transformed category, one village was selected. All the three transformed villages selected represented different altitudinal ranges.
In total, 404 families were selected randomly out of a total of 1,739 in the sample villages. Out of the selected families, 12 were landless, 152 marginal, 126 small, 62 medium, and 52 from the large holding category. Location and environmental background of the villages selected for the present study are shown in Table 1.
Table 1. Location and environmental background of study sites

Measurement of DAP Output
DAP output during different agricultural operations was measured by following the method used earlier by Matthews (1987). This method differs slightly from that of Singh and Naik (1987) and has the advantage of calculating power directly into the metric system (kW) rather than into the outdated foot-pound system (horsepower). Bullock energy expended during threshing operation, however, was based on the estimates of Singh and Naik (1987).
Experiments on DAP output during Ploughing, leveling, weeding, and threshing operations were conducted at three sites in each village under all farming systems. DAP output during puddling was observed in the Shivalik hills and transformed Middle mountains at the equal number of sites. Whereas the experiment on DAP output during puddling was conducted in July at the time of paddy transplantation, those on other agricultural operations were conducted in the months of October and November when the fields were being prepared for wheat cultivation after the millet and paddy harvest.
Measuring the Energy Content for Human Labour
Measuring the energy content of human labour which is one of the major sources of motive power in rural energy systems, is infinitely more complex, both conceptually and empirically. In particular relation to human labour complexities arise because of varying views as to whether human labour is a factor of production that is substitutable by energy, or a form of energy that is substitutable by other forms of energy (Ramani et al. 1995). However, for the ease of analysis of a production system and/ or ecosystem functioning inevitably depicting energy flow pattern, considering human labour in terms of energy, becomes urgent particularly when a concrete strategy is to be evolved. Considerable variation in the criteria of converting human labour into energy content exists in the past studies. Energy figures used by Revelle (1976), Gopalan et al.. (1979) and Bhatia and Sharma (1990) seem to be towards higher side. In our analysis we have used human energy input value sponsored by ICAR (1978), i.e. 0.1 hp or 0.075 kW per adult per hour, for it appears appropriate when we compare human weight with that of a local bullock.
RESULTS AND DISCUSSION
Quantification of DAP Output
It is difficult to quantify the ‘average’ performance of animals. Average or daily performance depends on species and their breeds, animals’ weight, rate and type of work, and geographical location. Climatic factors, such as excess heat, cold, and moisture, place additional stress on the work animals. Physiological state, quality of feed, designs of harnesses, yokes or implements, and human behaviour can also affect working performance of the animals. Physical condition, training and health of the animal, skill of the ploughman, texture of ground surface, and length and frequency of work periods are factors that can considerably affect the tractive efforts of the animals. An increase in speed causes a reduction in tractive effort exerted or in the length of the work period (Sarkar 1981 and Goe 1983).
Table 2 shows that highest draught power is expended when bullocks are used for ploughing. Though maximum tractive effort estimated is for puddling, the power expended was less than for ploughing due to considerable decrease in the rate of work. The average speed of bullocks was maximum when they were yoked for leveling operations, but decreased tractive effort reduces the power output in comparison to ploughing. The power developed in this operation is close to that in weeding and earthing-up. The data recorded are based on the performance of two bullocks, together weighing 500 kg, each bullock weighing 250 kg. Thus, at a given speed, the tractive efforts range from nine percent during weeding-earthing-up operations to 19 percent during puddling operations. For leveling and ploughing operations, these values are 10 and 16 percent. In general, tractive efforts, except for mules, asses, and elephants, range from 10 to 14 percent of body weight at speeds of 2.5 to four km per hour (Goe 1983), but, in our case, at about the same speed, tractive efforts during ploughing were nearly 16 percent of the body weight, and this might be indicative of a special ability of light, native draught animals to generate a greater percentage of body weight as tractive effort than heavy animals in other regions of the world.
A pair of hired bullocks on an average ploughs and levels 1,100 m2 per day during eight hours’ work, and this includes roughly one hour’s rest. However, when the bullocks are one’s own, they normally work for about five hours a day and, in this duration, they, on an average, plough and level just 700 m2. Average depths and widths of furrow were recorded to be 13.5 and 14.0 cm, respectively. At a Government farm in Chinyalisaur in Uttarkashi, Haryana bullocks ploughed a flat land area of 1,800 m2 in just three hours’ time.
Taking draught power developed during ploughing as a standard, per animal (average weight 250 kg) draught power output in our case comes out to 0.26 kW (0.35 hp), which is 30 percent less than 0.37 kW (0.50 hp) per animal average in India (Bhatia and Sharma 1990). It is because of the smaller size and lower weight of mountain animals. Lower draught power on this basis, however, is not indicative of local animals’ poor performance because the small size and lower weight of local animals are suited to mountain specificities. The draught capacity of the native animals can be improved considerably through proper feeding and improved DAP harness management. Compared to the draught power capabilities shown in earlier experiments on DAP output in Central Himalaya (Singh and Naik 1987), there have been considerable improvements. About a decade ago, average DAP output per animal (average weight 187 kg) during ploughing operation was 0.19 kW (0.25 hp), i.e., 27 percent less than recorded now. This is due to better animal care resulting in 34 percent increase in average weight of the animal. Over the last decade, there has been substantial change in the DAP system, and draught animals have assumed a greater role and have been provided with better care.
Table 2. Bullock draught power output during different agricultural
operations
| Operations | Average Speed (km/h) | Tractive Effort (kgf)1 | Power (kW)2 |
| Ploughing | 2.4 | 78 | 0.52 |
| Levelling | 2.7 | 48 | 0.36 |
| Puddling* | 1.6 | 95 | 0.42 |
| Weeding & Earthing up* | 2.6 | 47 | 0.34 |
Figures are based on eight hours' operation (seven hours' ploughing and one hour's levelling) by a pair of bullocks
Each bullock weighed 250 kg.
1 1 kgf = 9.806 Newton
2 1 kW = 1.34 hp
* Estimates based on Singh and Naik (1987)
DAP Potential and Balance
The potential value of the total power available for each hectare of land is presented in Table 3. Each bullock has been estimated to generate an average power value of 0.26 kW, on the basis of energy generated during ploughing. The total number of bullocks in a village has been multiplied by this average power value to obtain bullock power for a whole village, and thus for each zone. This value has been divided by total cropland area in the village to calculate the bullock power available for one hectare of cropland.
On the basis of considerable evidence, it has been accepted that 0.37 kW per ha of cropland should be available if any increase in productivity is to be expected (Mc Colly 1971). This shows that, if all the power is to be provided by bovines, all the zones, barring the traditional area in the Middle Himalaya, face a shortage, at least theoretically, of bovine power for agricultural work. While there is DAP surplus in traditional agriculture, Shivalik hill agriculture shows a quite substantial deficit. Transformed and high altitude agriculture indicate only a marginal DAP deficit. The high DAP deficit in the Shivaliks is, to some extent, substituted by tractors hired for land preparation.
Can this power gap be bridged up by human energy? Substitution of DAP with human energy is possible, but it would be less practicable. Some operations, e.g., ploughing, levelling, puddling, if they are carried out by humans would be impracticable or the production of the whole system would be drastically reduced. Other operations, e.g., irrigation, harvesting, transplanting, etc. in mountain agro-ecosystems use only human energy. Thus, in order to develop an efficient energy system, DAP and human power should be treated inseparably and not in terms of substituting one for the other.
The power required per ha, i.e., 0.37 kW, implies that a pair of bullocks is enough for two ha of cropland. This criterion, in fact, has been worked out for agriculture in the plains where draught capacity of each bullock is estimated to be 0.37 kW (0.5 hp). Yet, the draught capacity per animal in the mountains, as already shown, is only 0.26 kW, i.e., about 30 percent less than its counterpart in the plains.
Table 3. DAP potential and balance for mountain agriculture
| Particulars | Shivaliks | Middle Himalaya:
Traditional |
Middle Himalaya: Transformed | Greater Himalaya |
| Cropland Area, ha |
|
|
|
|
| Bullock No. |
|
|
|
|
| Available DAP, kW* |
|
|
|
|
| DAP, kW per ha of Cropland |
|
|
|
|
| Surplus (+), or Deficit (-) of DAP** |
|
|
|
|
* DAP value of each bullock = 0.26 kW
** Based on 0.37 kW per ha requirement of total power. If the available
human power is added, the total available power will be more than required
How much land can a pair of bullocks work without compromising the intended productivity? When farmers were asked this question, most of them said that a pair of bullocks can take care of 1.5 ha (75 nalis). In our case, average cropland area per pair of bullocks was as large as 2.28 ha in the Shivaliks and 1.74 ha in the transformed area in the Middle Himalaya, fairly agreeable in the Greater Himalaya (1.5 ha), and far less than appropriate in the traditional area in the Middle Himalaya (Table 4).
Table 4. Cropland area operated annually by available bullock
pairs
| Particulars | Shivaliks | Middle Himalaya:
Traditional |
Middle Himalaya:
Transformed |
Greater Himalaya |
| Cropland Area, ha |
|
|
|
|
| Available Bullock Pairs, No. |
|
|
|
|
| Area Operated Per Bullock Pair, ha |
|
|
|
|
| Balance in Area Operated Per Bullock Pair, ha* |
|
|
|
|
* Based on 1.5 ha as a standard area to be operated by a pair of bullocks.
This suggests that the cropland area operational for a pair of bullocks in the mountains should be equal to 1.4 ha. This figure can be stretched to 1.5 ha. The corresponding power requirement for mountain agriculture would, therefore, be 0.35 kW per ha of cropland. The overall power balance would thus be slightly lower than shown in the Table.
Bullock work hours
Recording animal working hours is necessary to evaluate the power actually used in the farms. Use of human energy is inevitably linked to all agricultural operations carried out by draught animals, i.e., ploughing, levelling, puddling, weeding, and threshing. Other operations--hand-weeding, irrigation, transport of manure and application, breaking of clods, sowing and transplantation, fertilizer and pesticide application, harvesting and hand-threshing--use human energy only.
From Table 5 (all values expressed in terms of one ha cropland over a period of one year), it is clear that in the Shivalik villages ploughing and harvesting operations for all crops need more bullock and human hours, respectively. Time needed for ploughing differs from crop to crop, the minimum being for pulses, oilseeds, and fodder (40 hours each) and the maximum for vegetables and lowland wheat. Variations in the usage of bullocks for ploughing depends on how much preparation the fields need before sowing a particular crop. Farmers have general estimates based on their own experiences. The same is true for other operations. Among all crops, lowland wheat and vegetables need more animal and human labour, respectively.
Winter crops use more bullock hours, while summer crops use more human hours. On the whole, some 1700 bullock hours and 9000 human hours are needed to cultivate all crops in a period of one year in the Shivaliks. Human work hours are more than five times those of bullocks.
In the Middle Himalayan villages under traditional system, bullock and human hours spent on the various operations needed to raise summer crops needed more work than for winter crops. Human hours in this area are three times those of bullock hours. Upland wheat requires more bullock hours and upland rice more human hours (Table 6).
In the Middle Himalayan village under transformed agricultural management, summer cropping consumes more bullock and human hours than winter cropping. Human hours devoted to annual cropping are five times the bullock hours. Lowland wheat requires the highest number of bullock hours and summer vegetables the highest number of human hours (Table 7).
In the Greater Himalayan villages human hours devoted to crop cultivation are about nine times the bullock hours. Amaranth crop needs more human and bullock hours than other crops (Table 8).
Among the four areas studied, the transformed Middle Himalayan villages require maximum bullock and human hours followed by the Shivalik villages. Whereas the total bullock hours required by traditional Middle Himalayan villages is nearly twice of requirement of the Greater Himalayan villages, the overall human hours required for the latter are more than for the former. The total work hours invested in summer season cropping are more than in the winter season, but the difference is the greatest in the case of the Greater Himalayan villages (see Figure 1).

Table 5. Working hours of bullocks in various operations for cultivation of different crops per hectare of cropland in the Shivalik villages
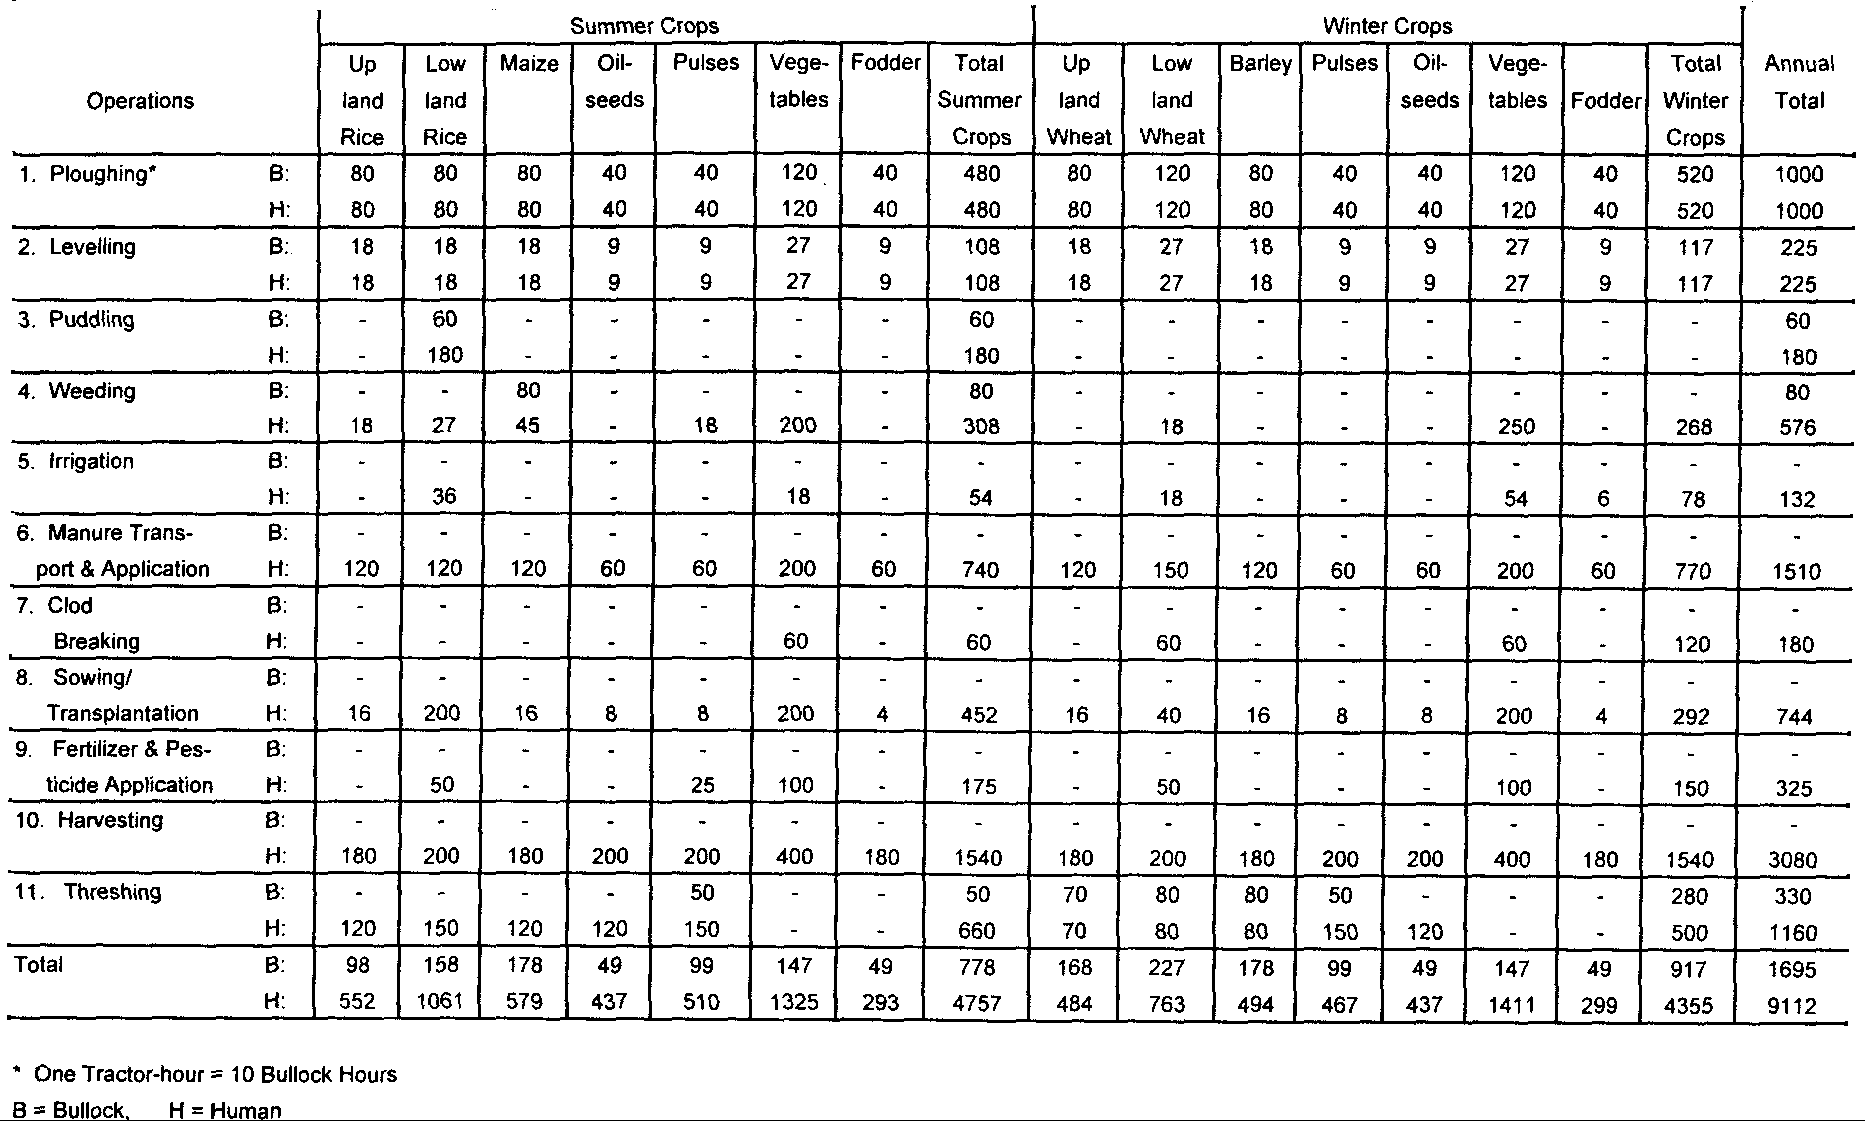
Table 6. Working hours of bullocks in various operations for cultivation of different crops per hectare of cropland in the Middle Himalayan traditional villages

Table 7. Working hours of bullocks in various operations for cultivation of different crops per hectare of cropland in the Middle Himalayan transformed villages
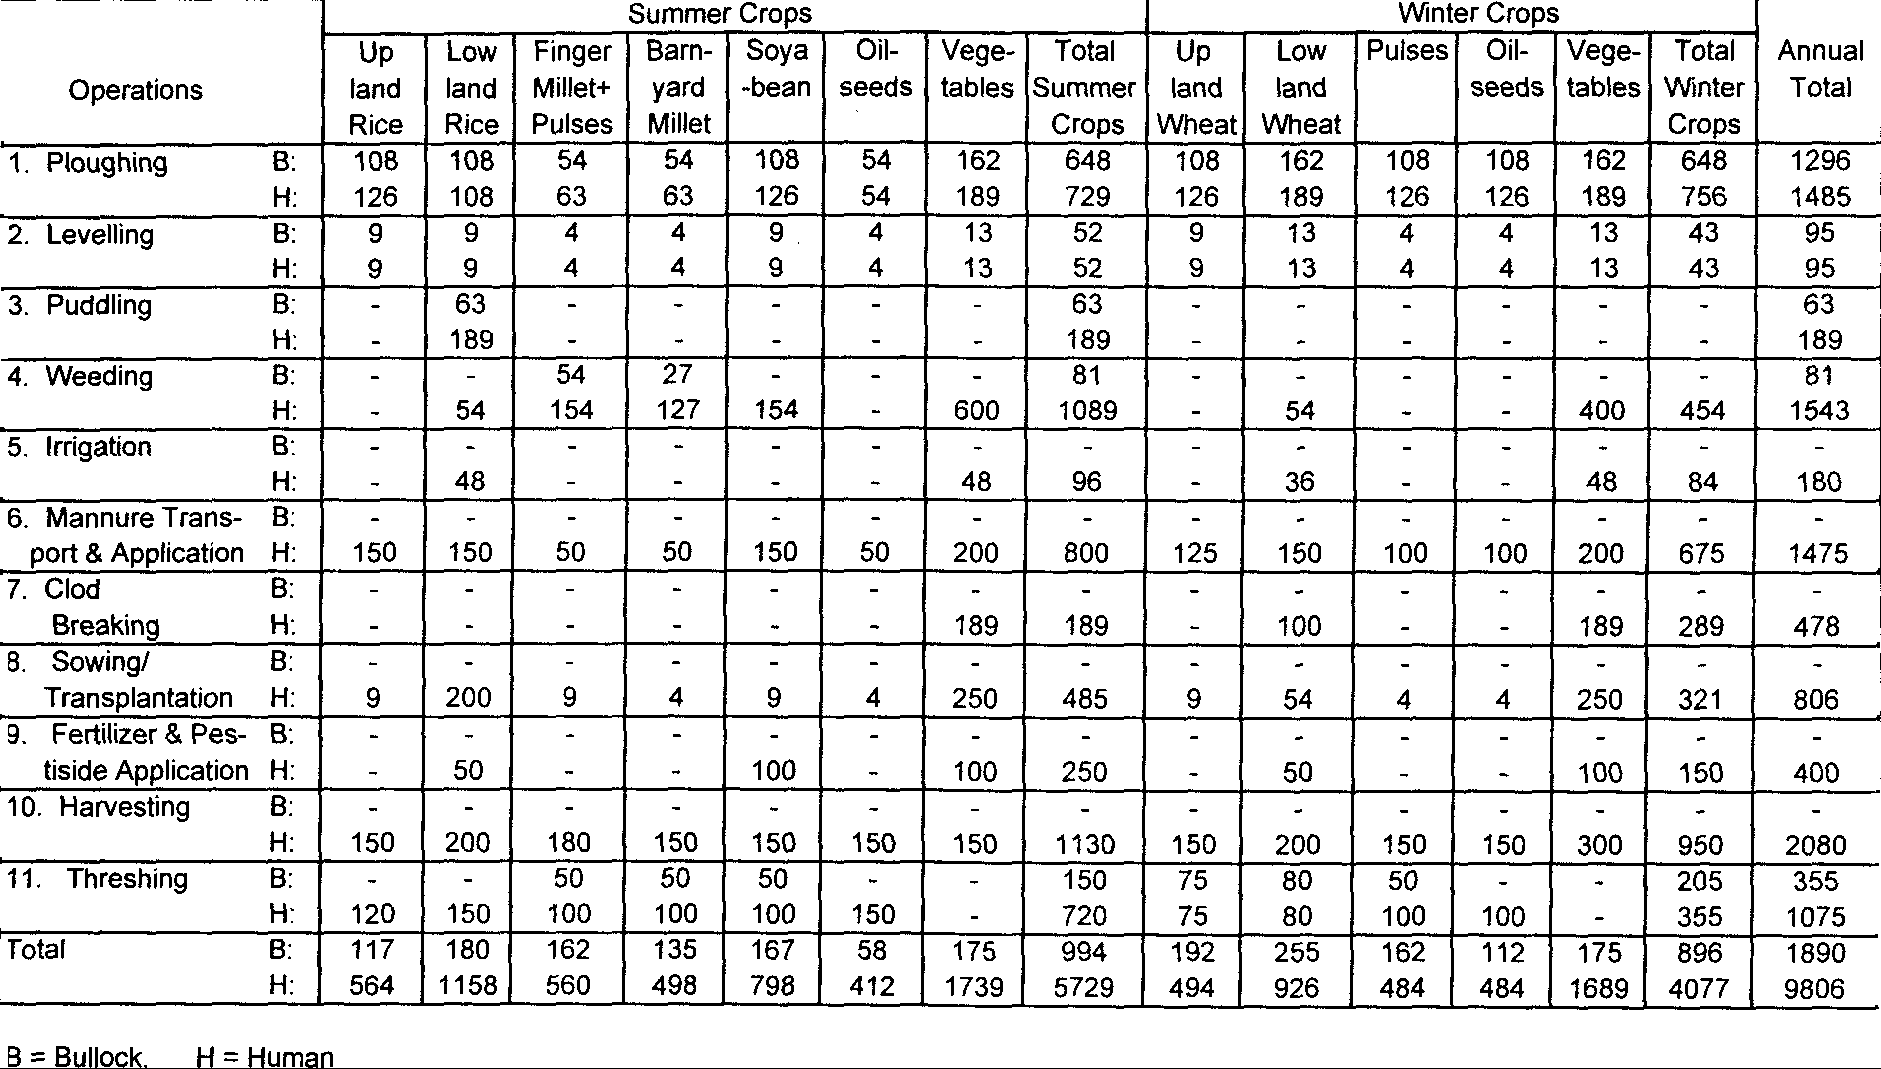
Table 8. Working hours of bullocks in various operations for cultivation of different crops per hectare of cropland in the Grater Himalayan villages
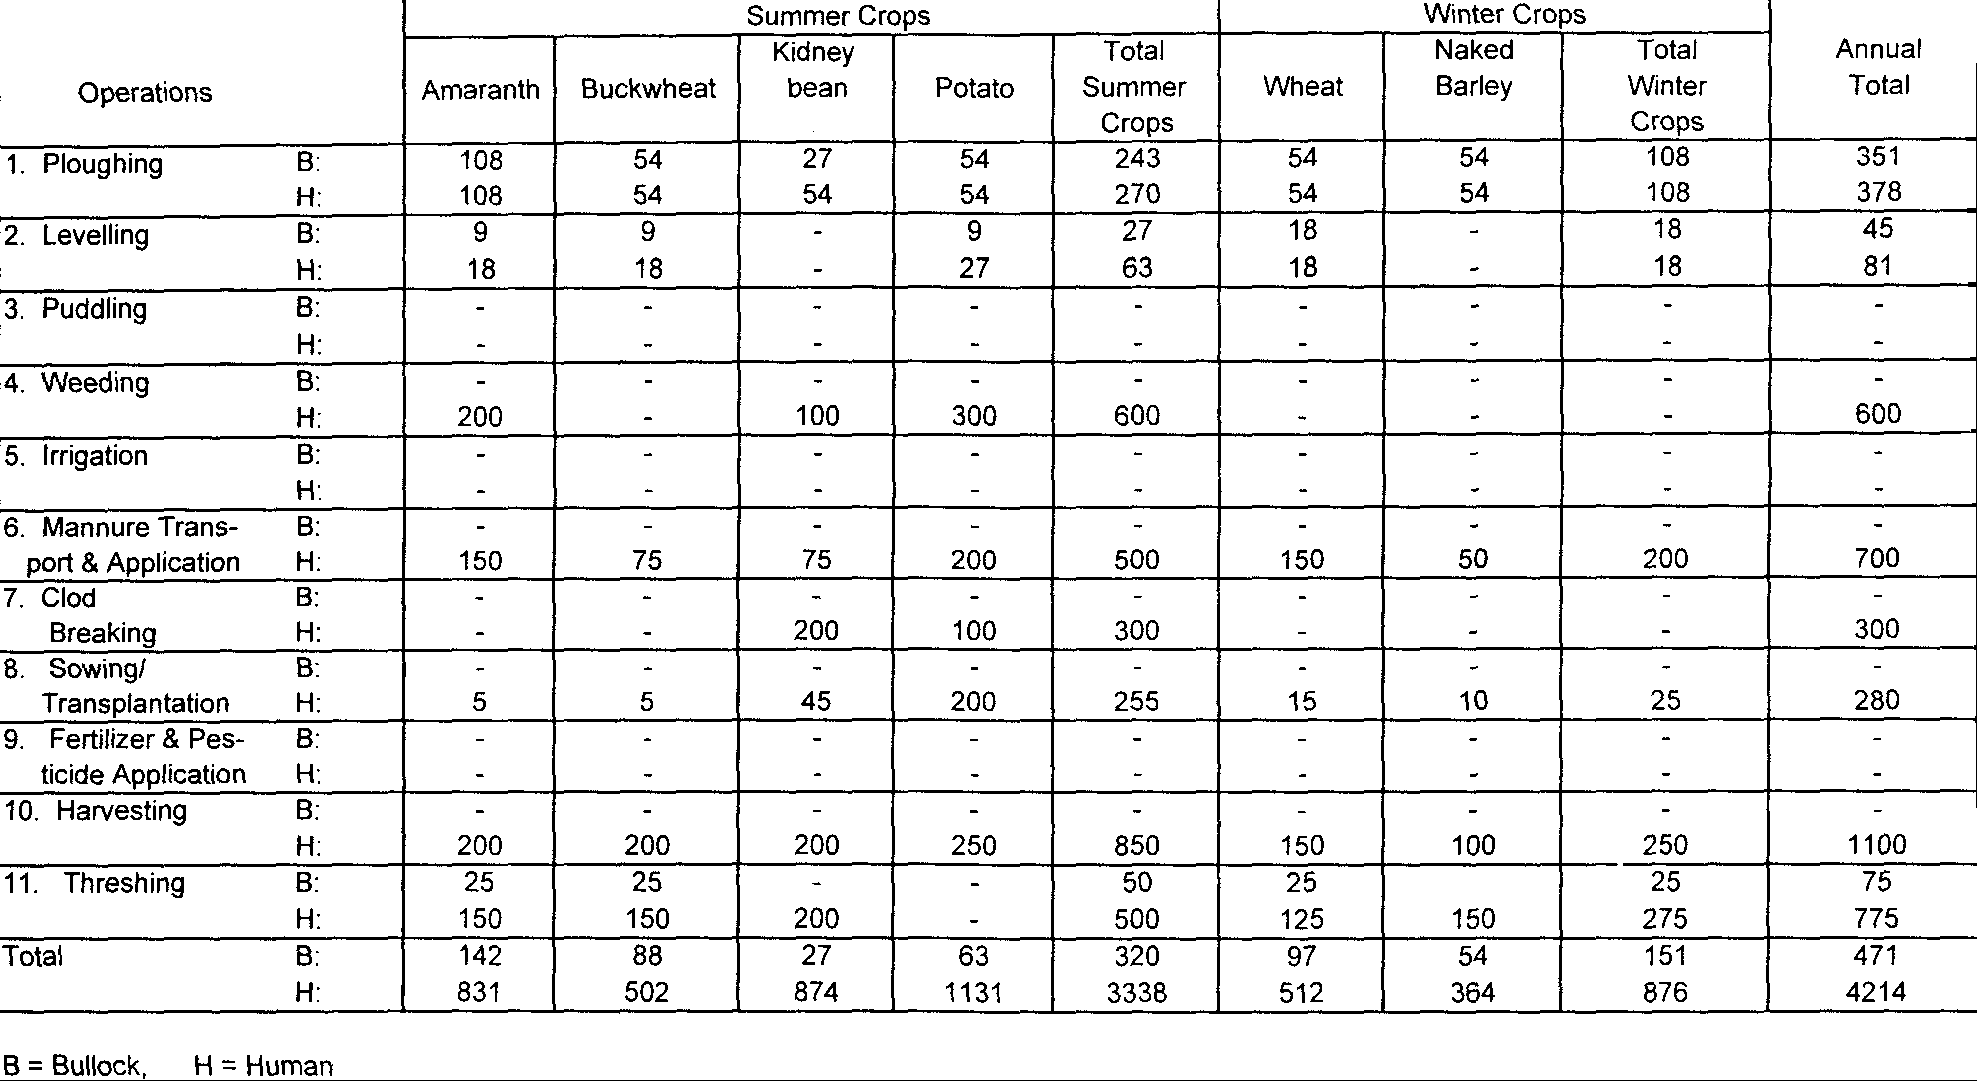
To look at crop-wise requirements for operations, we find that the highest figure is for summer vegetables in the transformed Middle Himalayan villages. The highest figure for total bullock and human hours is for lowland wheat and summer vegetables in the same category of villages, respectively. The greatest difference in human and bullock hours is in the case of the Greater Himalaya and smallest in the traditionally managed Middle Himalaya. The animate energy required for agriculture in Nepal given by Rijal et al. (1991) corroborates ours only in a few cases.
Considering an eight-hour day, it can be observed that bullocks work for the greatest number of days (236) in the transformed Middle Himalayan villages, followed by the Shivalik villages (212), and traditional Middle Himalayan villages (111). The Greater Himalayan villages use the bullocks only for 59 days in a year.
DAP Contribution to Crop Cultivation
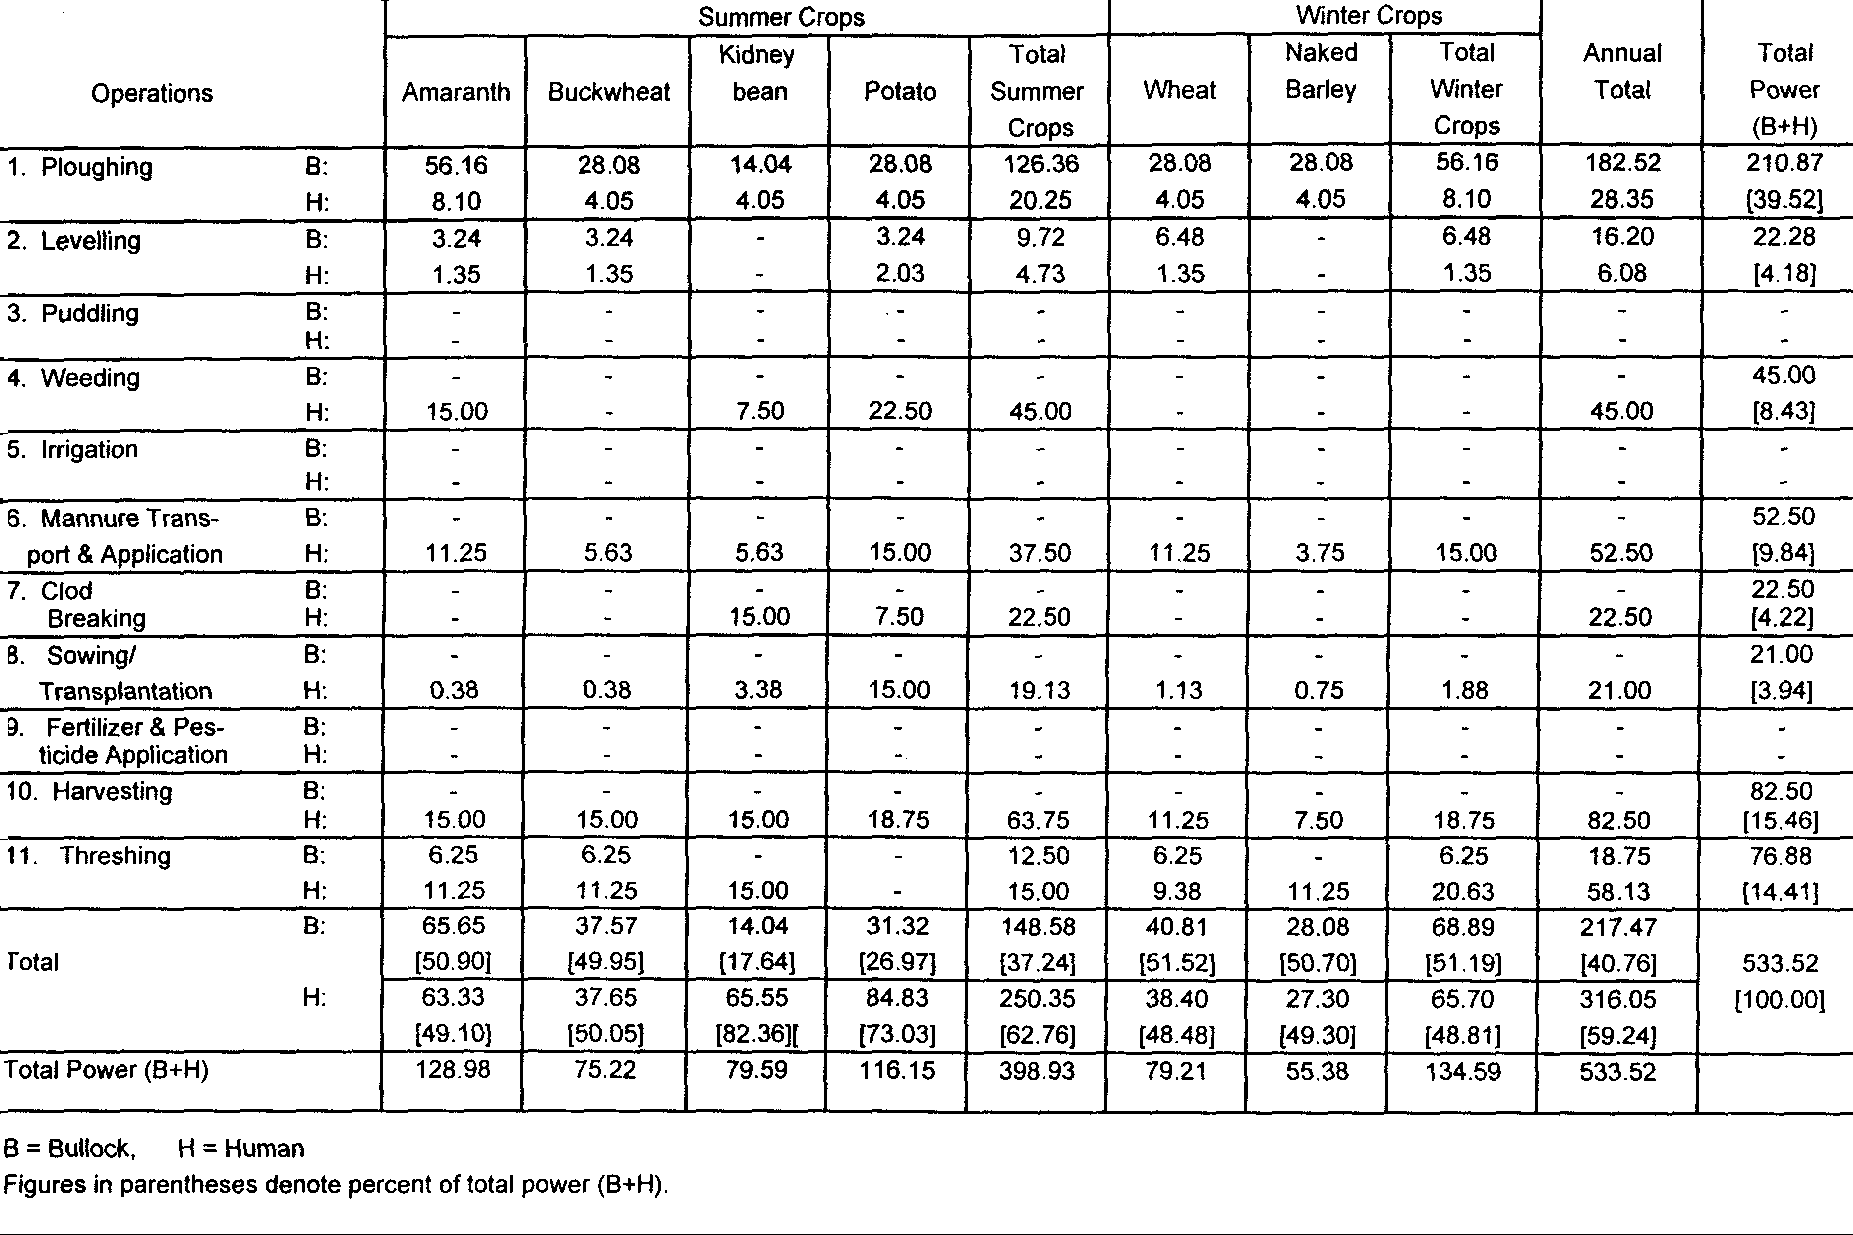
Tables 9 to 12 present data on the magnitude of power that actually goes into the cultivation of all major crops through various operations. All figures are based on per ha of cropland per year. In order to generate data on actual DAP contribution to the cultivation of individual crops per ha per year, the total hours devoted to an operation for the cultivation of a crop were multiplied by the DAP output (kW) for respective operations shown in Table 2. For threshing operation, energy estimate of 0.25 kW (Singh and Naik 1987) was used. One man-hour has been considered equal to 0.075 kWh (Ram 1982; Singh and Naik 1987).
The total DAP for ploughing for raising all major crops is the lowest (183 kWh) for the Greater Himalaya and the highest (674 kWh) for the Middle Himalaya (transformed areas). Ploughing operations for the preparing fields for raising lowland wheat crop and vegetables (84 kWh) in the Middle Himalaya (transformed areas) consume the maximum amount of DAP among all the zones, while kidney beans in the Greater Himalaya consume the lowest amount of DAP (14 kWh). This is due to the fact that tillage for lowland wheat and vegetables has to be done thrice, while kidney beans requires more human energy than bullock. power. Land under fodder crops in the Shivalik zone and under millets (finger millet and barnyard millet), pulses, oilseeds, and amaranth in the Middle Himalayan and Shivalik zones and under all crops (except amaranth) in the Greater Himalayan zone generally need little ploughing.
The human energy supplement during ploughing varies in the same fashion as bullock energy use, described above, does, because one man holds the plough for an equal number of hours as the bullocks work. However, in the Middle Himalayan villages, more human hours are spent during ploughing, for the corners of small terraced fields where the iron plough cannot reach, are to be prepared manually. Owing to less energy output, the total energy contribution of man will be less than that of bullocks.
Levelling operations for all crops are found to require a maximum amount of 81 kWh in the Shivaliks and a minimum of six kWh in the Middle Himalayan traditional areas with a range of from 10 kWh for cultivation of vegetables in the Shivaliks to one kWh for the cultivation of finger millet-pulses, barnyard millet, pulses, and oilseeds in the Middle Himalayan transformed areas. All the important crops in all zones, except for finger millet, barnyard millet, amaranth-kidney beans, and barley in the Middle Himalayan traditional villages and kidney beans and naked barley in the Greater Himalaya, require DAP input for levelling operations. The levelling is often omitted following ploughing if the terraced field is too narrow for the operation. Total human energy expended during levelling according to the DAP pattern.
Puddling operations for lowland rice cultivation consume 25 kWh and 27 kWh of bullock energy in the Shivaliks and Middle Himalayan transformed areas, respectively. This operation is not necessary for other crops including upland rice. The human energy supplement in this operation is more than for ploughing and levelling operations because of the greater number of mandays involved.
Weeding operations (earthing-up and interculture processes often associated) with bullocks use 37 kWh of energy in the traditional areas of the Middle Himalaya and nearly equal amounts (about 27 kWh) in the Shivaliks and transformed areas of the Middle Himalaya for the cultivation of all crops per ha annually. The Greater Himalaya uses no DAP for weeding operations. Bullock-drawn weeders are used only for maize (reported from only one sample village), upland rice (reported from only one sample village), finger millet-pulses, and barnyard millet crops. Among these crops, maize uses the highest amount of DAP (27 kWh) in the Shivaliks/ foothills, followed by finger millet-pulses (18 kWh) and upland rice and barnyard millet (each 9 kWh) in the Middle Himalaya. The human energy inputs are most during the weeding of winter vegetables in the transformed areas of the Middle Himalaya and minimum for upland rice and lowland wheat.
DAP is not used for the irrigation of crops. Irrigation facilities exist only in two zones, the Shivaliks and the transformed Middle Himalaya. They may also exist in other zones, but only rarely. In areas in which irrigation facilities are plentiful, there is more likelihood that considerable changes have taken place with respect to agricultural practices. Millets, maize, oilseeds, barley, pulses, and pseudo-cereals are always raised in rainfed conditions. In the Middle Himalaya, rice and wheat crops at mid-altitudes and vegetables at high altitudes, where moisture percentage is high, are also raised without irrigation. Water from small rivulets and springs is sometimes diverted to vegetables at high altitudes in the Middle and Greater Himalaya. More human energy is needed for the irrigation of crops for transformed agriculture than for hill agriculture. Lowland rice and winter vegetables require more human energy inputs.
Transporting and applying manure involve human inputs only. In one of the sample villages, nearly 50 percent of the energy needed is met by employing mules. One mule hour service has been regarded equal to eight hours of human labour. The total human energy spent during compost transport and application is the maximum per ha area (113 kWh) in the Shivaliks with a resembling value (110 kWh) in the transformed Middle Himalaya and minimum in the traditional Middle Himalaya. Vegetables in the hills and mountains including potatoes in the Greater Himalaya, require high energy inputs to accomplish this task. In the fields in which finger millet, barnyard millet, pulses, oilseeds, and pseudo-cereals are grown, energy requirements for manure transport and application are the lowest. The energy expended in this operation, apart from individual crop requirements, varies according to the amount of manure available, distance from the households to the fields, cropping patterns/ rotations, and cropping intensities.
Clod breaking requires only human inputs. Clod breaking (or beating) is required especially to prepare the fields for lowland wheat after rice harvesting. The huge amounts of water used for cultivation of rice turns the soil compact and in such fields the first tillage results in unworkable clods or lumps, and these need to be beaten to finer or workable sizes. Lowland wheat in the Shivalik hill areas requires about eight kWh per ha of cultivated land. Even upland wheat areas under ‘rice-wheat’ rotations demand quite high amounts of human energy (8 kWh) for clod breaking. The maximum amount of energy (15 kWh), however, is invested in the preparation of the fields for kidney bean cultivation in the Greater Himalaya. Field preparation for vegetable cultivation in the Middle Himalayan transformed farming systems is also an energy-intensive exercise (about 14 kWh) when breaking of clods is to take place.
While sowing operations for cultivation of foodgrain crops demand low human energy inputs, transplantation of lowland rice and vegetables requires huge amounts of energy, because large mandays are employed in this process.
Human energy used for fertilizer and pesticide applications on all crops on every hectare of cropland annually is higher in transformed areas (30 kWh) than in the Shivaliks (24 kWh). Use of chemical fertilizers and pesticides in two other study areas is rare. Vegetables need a lot of work and the energy needed is higher than lowland rice and wheat. No upland crops, or crops raised under rainfed conditions, apart from soybeans, use human energy for chemical and pesticide applications. The energy requirement for soybeans for this operation is equal to the energy needed for vegetables.
The total human energy input for the harvesting crops on each ha of
cropland annually is the highest (231 kWh) in the Shivaliks, followed by
transformed agricultural areas (156 kWh), and the Greater Himalaya (83
kWh) and lowest (72 kWh) in the traditional agricultural areas. Energy
used for harvesting of vegetable crops is greater than for foodgrain crops.
Table 9. DAP contribution to the cultivation of different crops
through all agricultural operations (kWh/ha) in the Shivalik villages
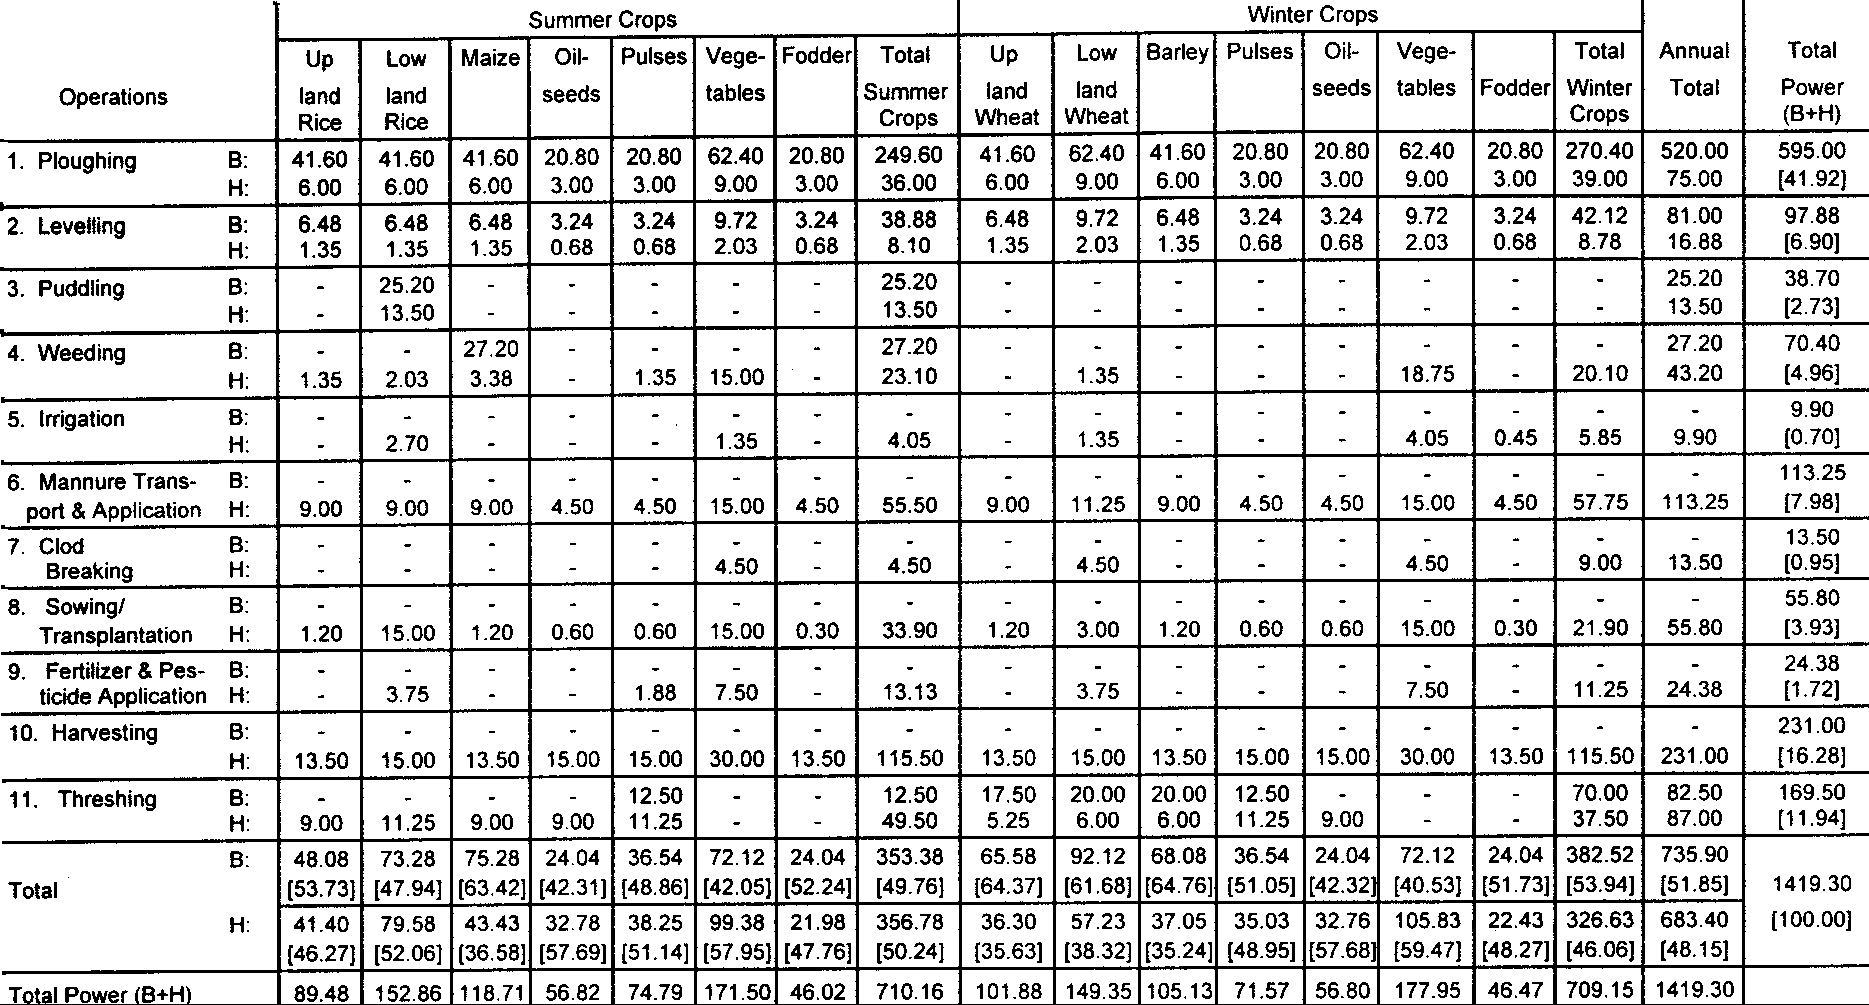
B = Bullock, H = Human
Figures in parentheses demote percent of total power (B+H).
Table 10. DAP contribution to the cultivation of different crops through all agricultural operations (kWh/ha) in the Middle Himalayan traditional villages
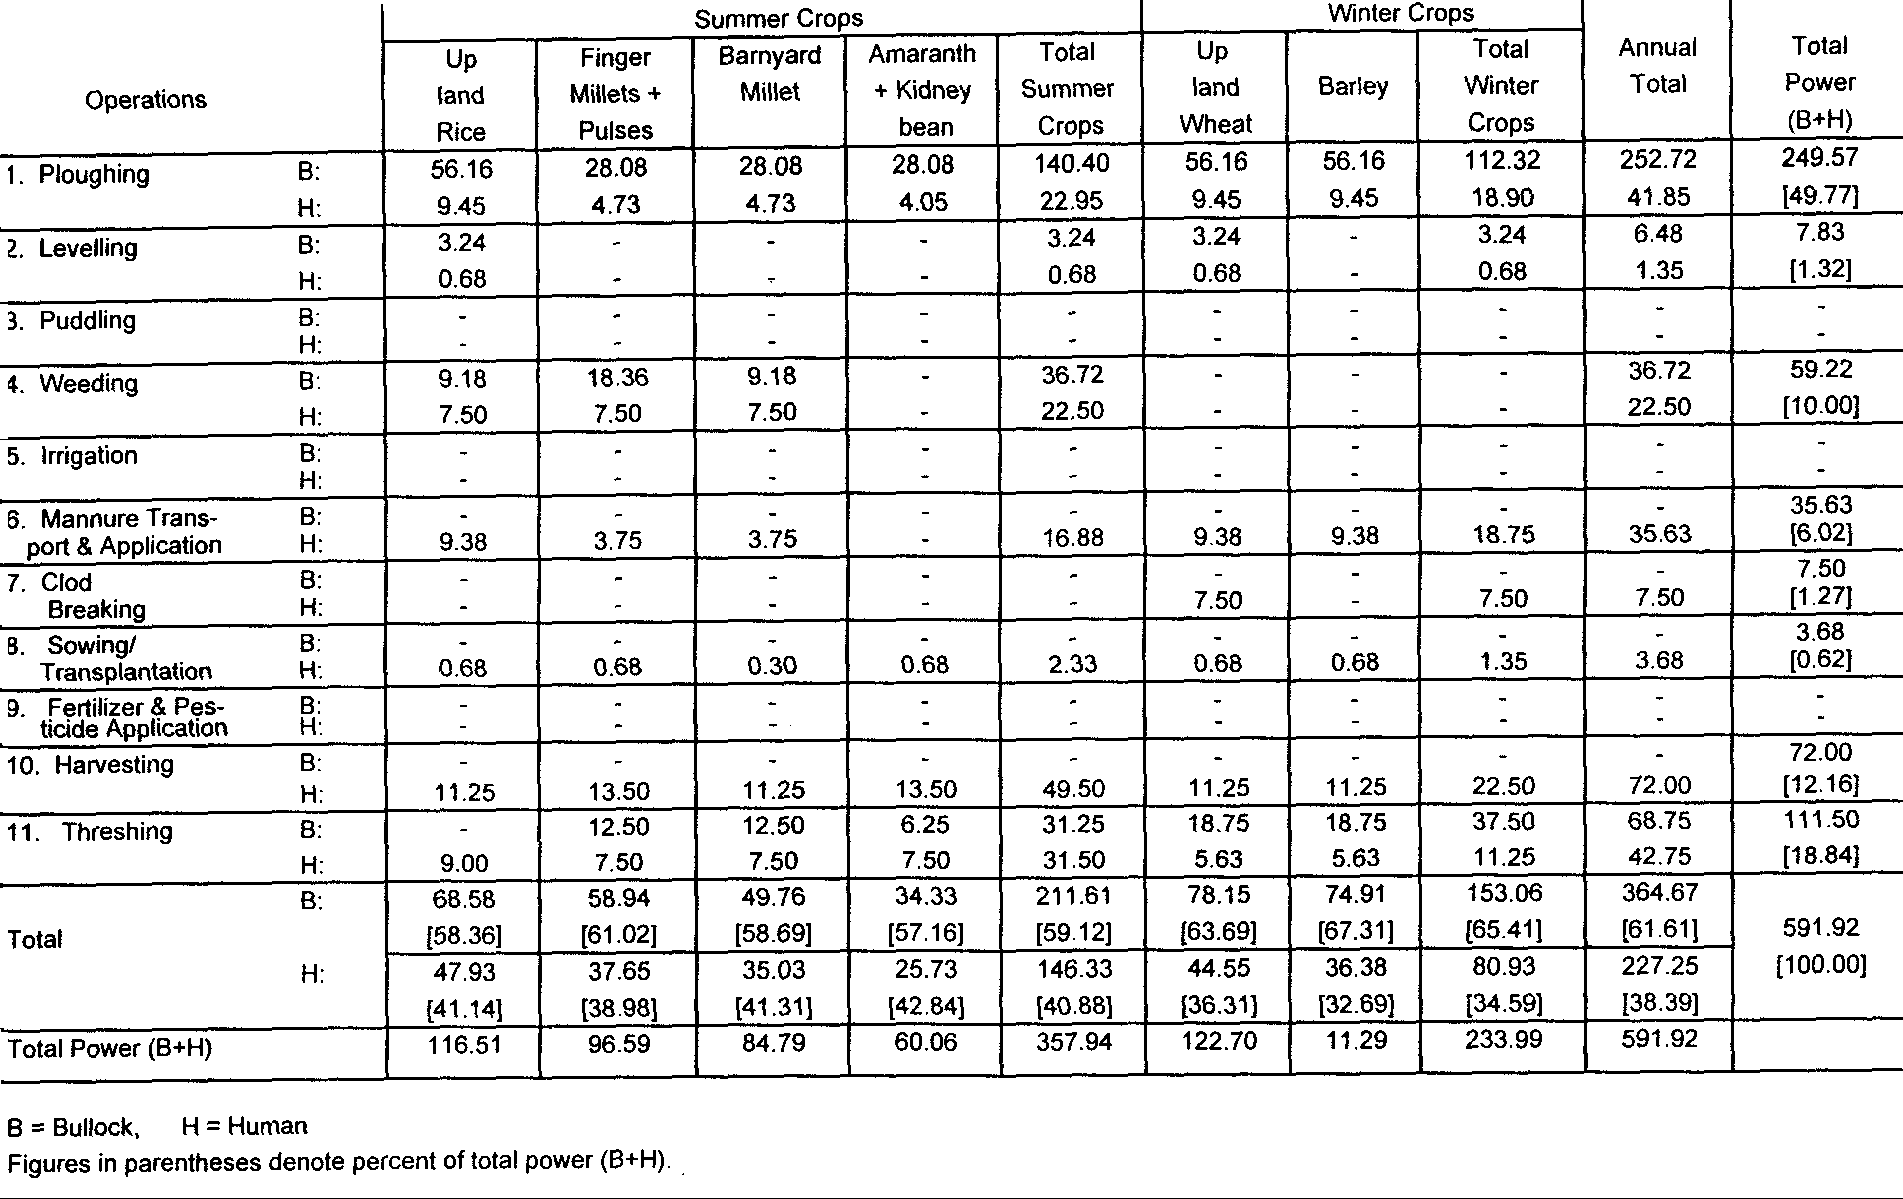
Table 11. DAP contribution to the cultivation of different crops through all agricultural operations (kWh/ha) in the Middle Himalayan transformed villages
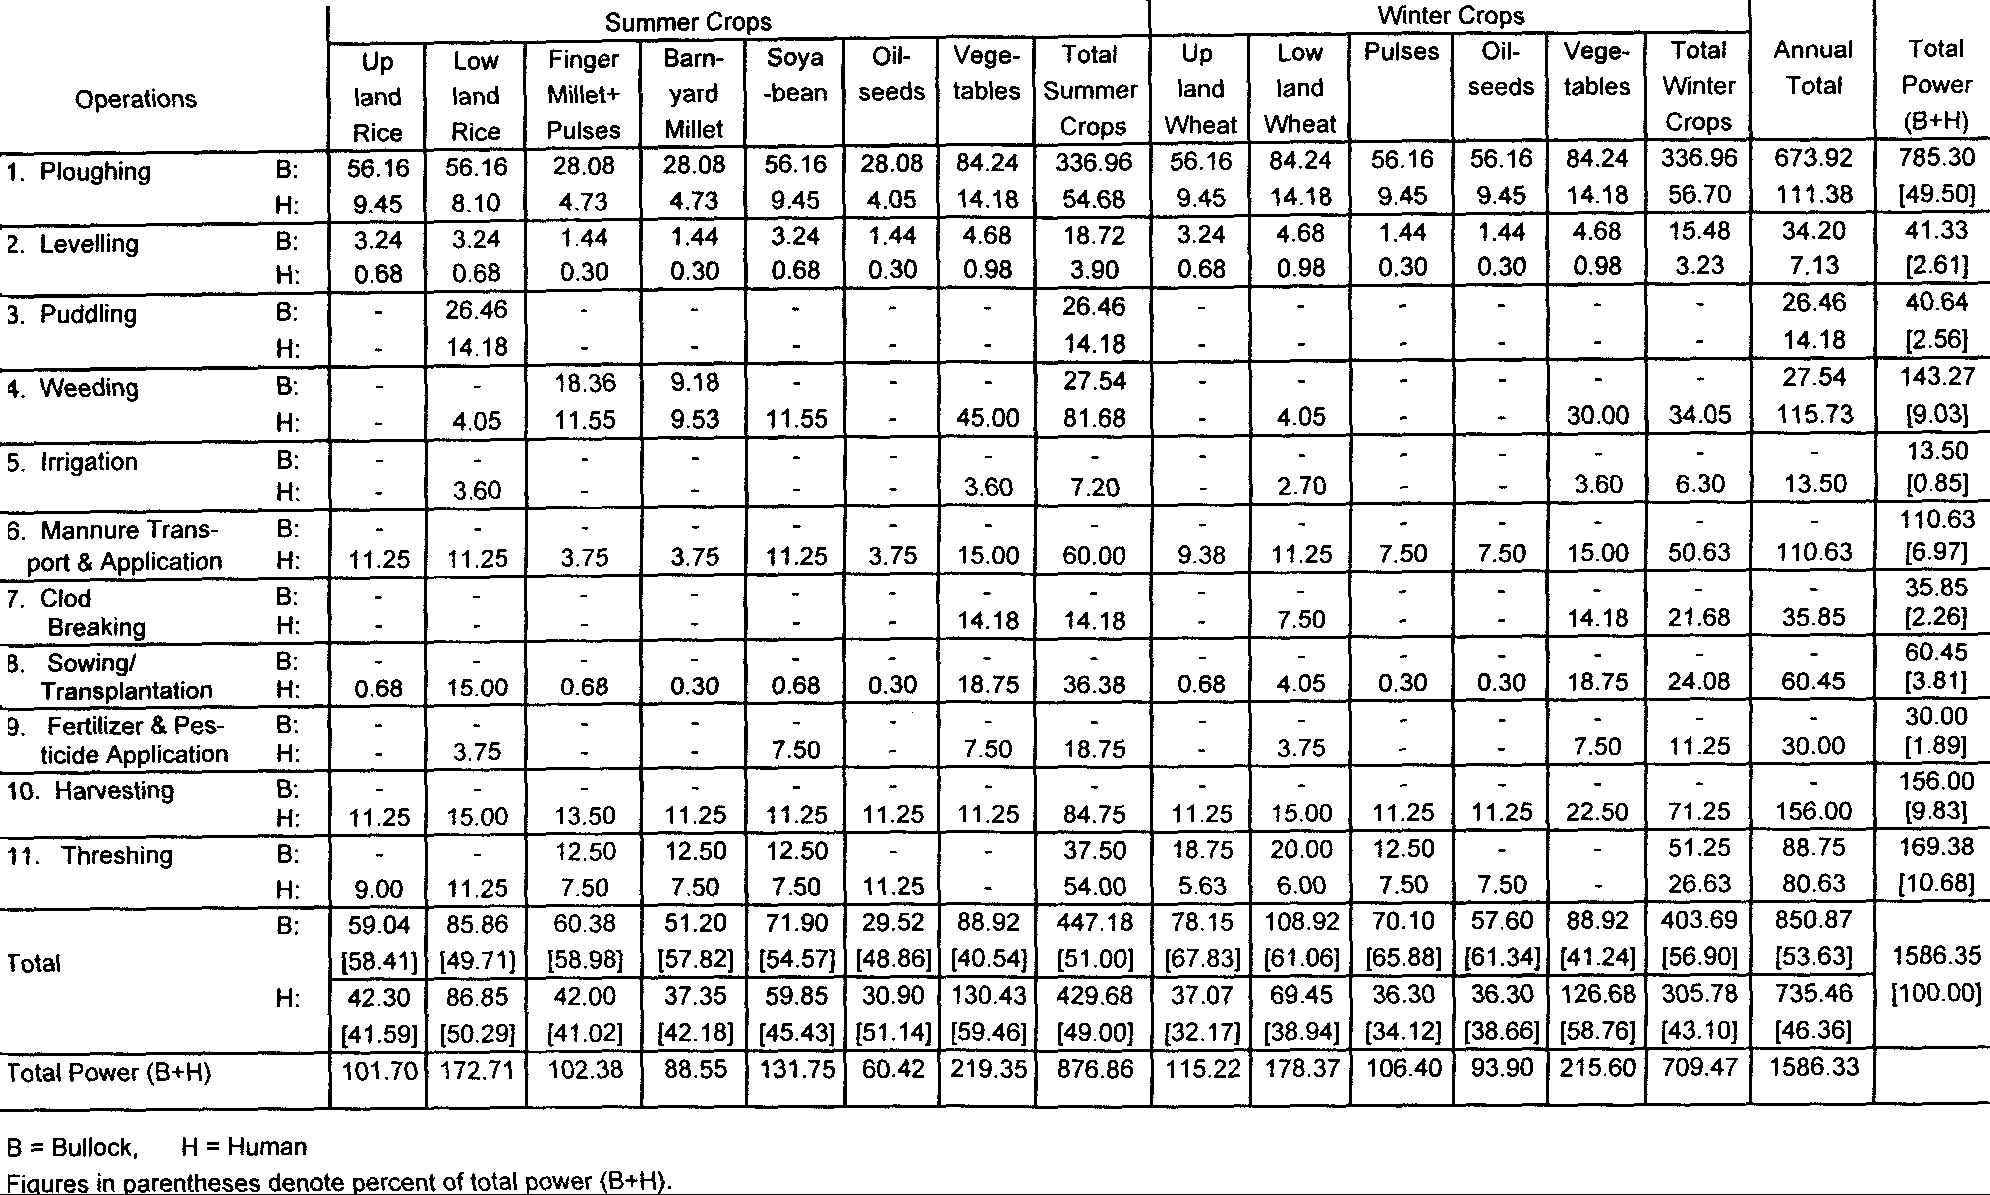
Table 12. DAP contribution to the cultivation of different crops through all agricultural operations (kWh/ha) in the Greater Himalayan villages
Human energy for threshing of all crops on each ha land annually ranges from a high of 87 kWh to a low of about 43 kWh in the Shivalik hills and traditional agricultural areas, respectively. These figures for transformed areas and the Greater Himalaya are 81 kWh and 58 kWh, respectively. Threshing wheat, barley, pulses, pseudo-cereals, and millets also uses animal energy input.
Animal energy for threshing is maximum (about 89 kWh) in the transformed agricultural areas and minimum (about 19 kWh) in the Greater Himalaya. These values for the Shivalik hills and traditional agriculture are 83 and 69 kWh, respectively.
Among all the agricultural operations, the total (bullock and human) power contribution is the highest during ploughing. It ranges from about 40 to 42 percent for the Greater Himalayan and Shivalik hill agriculture to about 50 percent for the Middle Himalayan agriculture. Harvesting and threshing operations use quite high percentages of total power, second only to ploughing. Weeding (except in the Shivalik hill zone) and transporting and applying manure in terms of uses of power, are third. All other operations use only low amounts of total power. DAP predominates in ploughing, levelling, puddling, and weeding operations and, in the Middle Himalaya, in threshing also.
Looking at crop-wise contributions from bullock and human power, we find that it is summer vegetables in the transforming mountains areas that absorb maximum energy input per ha (about 219 kWh), followed by winter vegetables (about 216 kWh) and lowland wheat (about 178 kWh), in the same area, and winter vegetables (178 kWh) in the hills. In the traditional mountains and Greater Himalayan mountains, upland wheat (about 123 kWh) and amaranth (about 129 kWh) use the highest amounts of power. Fodder in the hills and naked barley in the Greater Himalaya use the lowest amounts of power, about 46 and 55 kWh per ha, respectively. Barley in the hills and traditional mountain areas, and upland wheat in the transformed mountain areas and Greater Himalayan zone use major share of DAP out of the total power input, i.e., about 65, 67, 68,, and 52 percent respectively, while vegetables, amaranth-kidney beans, vegetables, and kidney beans, in these respective areas, use the greatest share of human energy, i.e., nearly 57, 43, 59, and 82 percent, respectively. This pattern demonstrates that irrigated crops use more human energy (kidney beans in the Greater Himalaya being an exception) and un-irrigated crops generally use more DAP (see Figure 2 also).
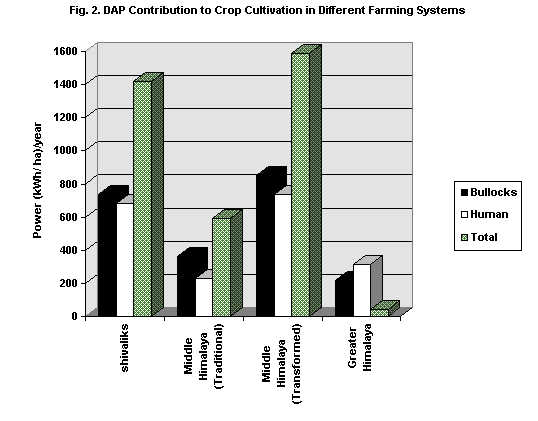
The overall bullock and human energy that goes into per ha crop cultivation through all operations annually amounts to about 1419, 592, 1586, and 534 kWh in the hills, traditional mountains, transformed mountains, and high Himalaya, respectively. This means that agricultural transformation is an energy-intensive process. Transitional hill agriculture, in terms of power use, is in second place, traditional mountain agriculture in third place, and ‘primitive’ type high mountain agriculture last. Looking at the DAP contribution to overall power, we find that high mountain agriculture uses only about 41 percent DAP, hill agriculture about 52 percent, transformed agriculture about 54 percent, and traditional agriculture as much as 62 percent of DAP for crop cultivation. This pattern suggests that cropping intensity increases pressure on human beings in terms of energy needed. The reason of that high mountain agriculture is the exception is that there is less diversification in the cropping, and no household in a typical livestock-based farming setting (Bagauri, for example) owns any bullocks and many households carry out all operations manually. Furthermore, kidney beans, raised mainly around the homesteads, and potato cultivation require human energy for the most part. The contribution of human energy to the cultivation of other crops in this area, nevertheless, is only nearly 50 percent. The transformed agricultural system makes most efficient use of available DAP and human resources, and this is reflected in the greater degree of cropping diversification and higher crop yields in the area.
ACKNOWLEDGEMENTS
This paper is based on a research work carried out under an ICIMOD Research Fellowship. Financial support and all necessary facilities provided by ICIMOD are gratefully acknowledged.
REFERENCES
Bhatia, R and Sharma, R. 1990. Energy and agriculture: a review. In
Desai, A V (ed.) Patterns of Energy Use in Developing Countries.
New Delhi: Wiley Eastern India, 205-251.
Goe, M R. 1983. Current status of research on animal traction. World
Animal Review 45: 2-17.
Gopalan, C B, Ramasastri, V and Balasubramanium, S C. 1979. Nutritive
Value of Indian Foods. Hyderabad, India: National Institute of Nutrition.
ICAR (Indian Council of agricultural Research). 1978. Report on Energy
Requirements of Intensive Agricultural production 1977-78. Pantnagar, India:
GBP university.
Matthews, M D P. 1987. Measuring draught animal power of Carabaos crossed
with exotic buffaloes. World Animal Review 63: 15-19.
Mc Colly, F. 1971. Proposal of agricultural mechanisation in the countries
of South-east Asia. Agricultural Mechanisation Asia. Spring 1971:
25-35.
Ramani, K V, Reddy, A K N and Islam, M N(eds.). 1995. Rural Energy
Planning: A Government- Enabled Market-Based Approach. Kuala Lumpur, Malaysia:
APDC & GTZ, 252-253.
Ram, R A. 1982. Use of bullock power in farming system. Proceedings
and Seminar Papers Bangalore, India: IIM.
Revelle, R. 1976. Energy use in rural India. Science 192:
969-975.
Rijal, K, Bansal, N K and Grover, P D. 1991. Energy and subsistence
Nepalese agriculture Bioresource Technology 36: 1991.
Sarkar, R I. 1981. Improved utilization of animal draught power in
Bangladesh. In Jackson et al (eds.) Maximum Livestock Production from
Minimum Land. Mymensingh, Bangladesh: Bangladesh Agricultural university.
Singh, V and Naik, D G. 1987. Animal draught power in the mid-altitude
Himalayan villages. In Pangtey, P S and Joshi, S C (eds.) Western Himalaya:
Environment, Problems and development, Vol. II. Nainital, India: Gyanodaya
Prakashan, 755-770.
Srivastava, N S L and Yadav, G C. 1987. Perspective planning for draught
animal power for the year 2000. Proceedings of National Seminar on Status
of Animal Energy Utilization. Bhopal, India: CIAE.
|
|
|
|
|