The method, illustrated in the following examples, applies to all polynomial
and rational inequalities.
Polynomial Inequalities
Solve
Get
Solve the resulting equation to find the x-intercepts of the polynomial.
In our problem,
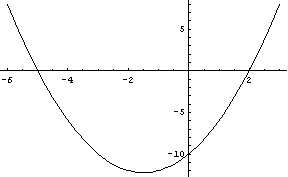
Look at the graph of

The graph of the function is displayed only to motivate what we are going
to do, so we can see what is going on. It is not a step in the method itself.
Any point on the plane is given by two coordinates, the x-coordinate giving
the horizontal displacement of the point and the y-coordinate giving the vertical
displacement of the point,
To find the x-intercept (where the graph intersects the x-axis) of the function
we set
We must solve the equation
Factor the left side, so we can use the Zero Product Principle.
and
The x-intercepts are the points
Look at the points indicated on the graph above.
For all values of
are all above the x-axis, their vertical displacements from the x-axis
are positive :
For points
For all values of
the corresponding points on the graph are all below the x-axis, their vertical
displacements from the x-axis are negative :
For all values of
the x-axis, their vertical displacements from the x-axis are positive :
All these information can be summarized by drawing a horizontal number line
on which the x-intercepts are indicated as well as the signs of the coordinate
on each subinterval of the line.
We see that the x-intercepts, -5 and 2, divide the number line into three subintervals.
Now, let's get back to the method itself after this attempt at motivating it :
To determine the sign of
to draw the graph. All we have to do is find the value of
arbitrary point in each of these subintervals.
If the value of
for all values of
Okay, let's see how these works:
In the subinterval
Any value of
in the subinterval
Why?
Well, if
that the graph at that point lies below the x-axis and so the graph must intersect
the x-axis at some point in the subinterval, have another x-intercept.
But wait - !
We found all the x-intercepts of the graph. There are only two of them,
at
Conclusion:
If the graph is above the x-axis (
above the x-axis (
Similarly, if it is below the x-axis (
below the x-axis (
To finish the problem, just look at the number line.
The problem was to find the values of
Less than zero means negative.
Where do you see the negative sign on the line?
The middle subinterval, that is the answer. The solution set is
At the endpoints
so these endpoints are not included in the solution set.
If the problem were
to find the answer just look at the number line.
Where do you see the positive sign?
The subintervals on the left and on the right.
The solution set is
At the endpoints
so these endpoints are included in the solution set.
An outline of the method is on page 155.
See the example on pages 153 - 154, and Example 1, pages 155 - 157.
Rational Inequalities
To solve a polynomial inequality,
we solve the equation
To solve a rational inequality,
 ,
,we must solve the equations
and
Note that in both cases we must put the inequality in standard form,
namely, one side must be
Solve
First, put it in standard form.