
|
STEP 2: ESTIMATE DEMAND AND SERVICE |
|
|
Total Revenue |
|
The total money received from the sale of a product.
|
|
Average Revenue |
|
The average amount of money received for selling one unit
of a product.
|
|
Marginal Revenue |
|
The change in total revenue obtained by selling one
additional unit.
|
|
FIGURE 13-7 Fundamental revenue concepts |

|
FIGURE 13-8 How a downward-sloping demand curve affects total, average, and marginal revenue |

|
STEP 2: ESTIMATE DEMAND AND SERVICE |
|
|
Price Elasticity of Demand |
|
The percentage change in quantity demanded relative to a
percentage change in price.
|
|
Concept Check |
|
1.
What is the difference between a movement
along and a shift of a demand curve?
A:
A movement along the demand curve occurs
when the price is lowered and quantity demanded increases, assuming that
other demand factors remain unchanged.
If some of these factors change, however, a shift of the demand
curve results.
2.
What does it mean if a product has a price
elasticity of demand that is greater than 1?
A: Elasticities
greater than 1 indicate the product is price elastic.
|
|
STEP 3: DETERMINE COST, VOLUME, AND PROFIT RELATIONSHIPS |
|
|
|
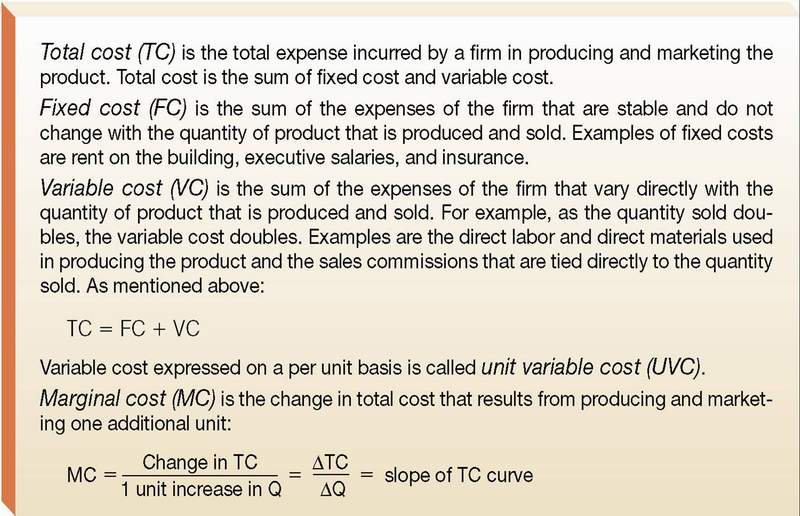
Total Cost |
|
The total expense incurred by a firm in producing and
marketing a product. Total cost
is the sum of fixed cost and variable cost.
In physical distribution decisions, the sum of all applicable
costs for logistical activities.
|
|
Fixed Cost |
|
The sum of expenses of the firm that are stable and do not
change with the quantity of product that is produced and sold.
|
|
Variable Cost |
|
The sum of the expenses of the firm that vary directly with
the quantity of product that is produced and sold.
|
|
Marginal Cost |
|
The change
in total cost that results from producing and marketing one additional
unit.
|
|
FIGURE 13-9 Fundamental cost concepts |
|
STEP 3: DETERMINE COST, VOLUME, AND PROFIT RELATIONSHIPS |
|
|
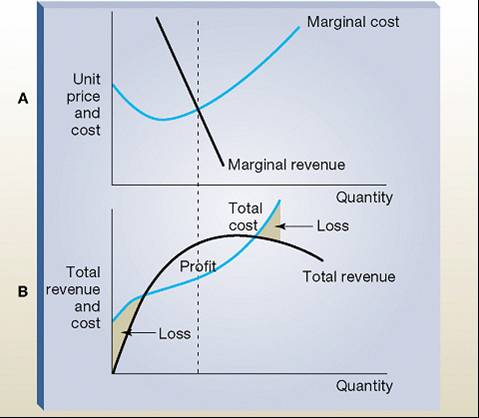
Marginal Analysis |
|
A
continuing, concise trade-off of incremental costs against incremental
revenues.
|
|
FIGURE 13-10
|
|
STEP 3: DETERMINE COST, VOLUME, AND PROFIT RELATIONSHIPS |
|
|
|
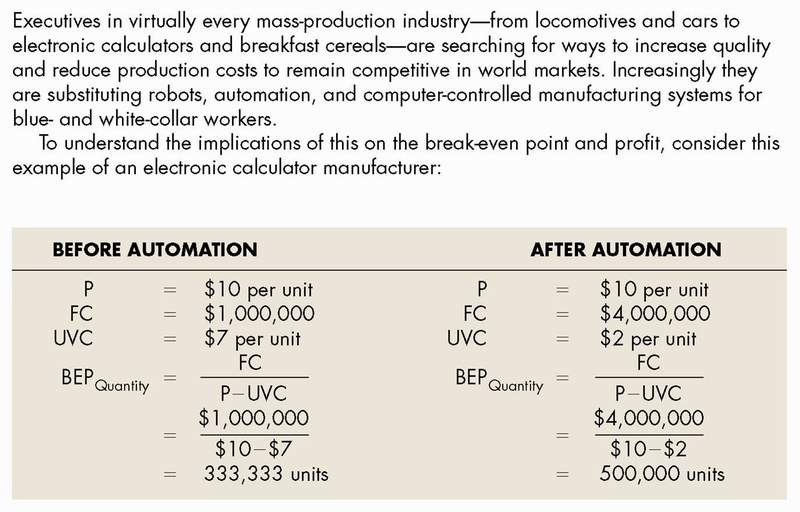
Break-Even Analysis |
|
A technique
that analyzes the relationship between total revenue and total cost to
determine profitability at various levels of output.
|
|
Break-Even Point |
|
Quantity at
which total revenue and total cost are equal and beyond which profit
occurs.
|
|
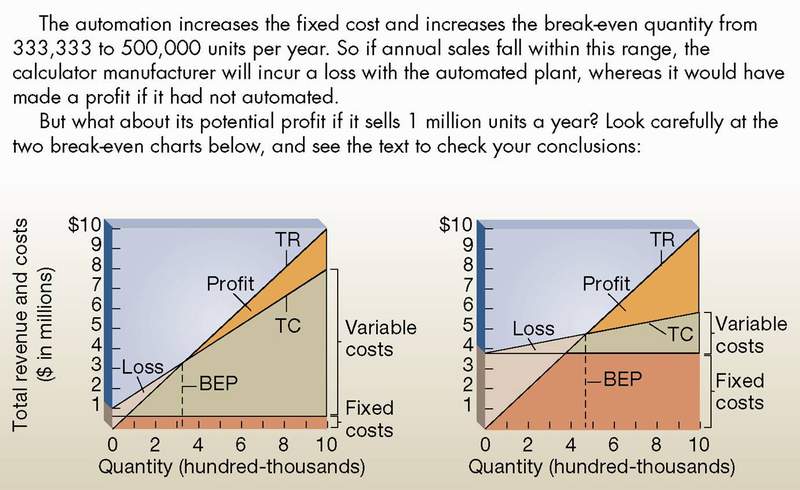
Break-Even Chart |
|
A graphic presentation of the break-even analysis.
|
|
FIGURE 13-11 Calculating a break-even point |
![]()
|
FIGURE 13-12 Break-even analysis chart |

|
STEP 3: DETERMINE COST, VOLUME, AND PROFIT RELATIONSHIPS |
|
|
FIGURE 13-13a The cost trade-off: fixed versus variable costs |
|
FIGURE 13-13b The cost trade-off: fixed versus variable costs |
|
Concept Check |
|
1.
What is the difference between fixed costs
and variable costs?
A: Fixed costs are
stable and do not change with the quantity of the product that is
produced and sold. Variable costs
vary directly with the quantity of the product that is produced and
sold.
2.
What is a break-even point?
A: The break-even
point is the quantity at which total revenue and total cost are equal
and beyond which profit occurs.
|
|
Chapter 13 - Summary |
|
|
News, Articles & Links
Quizzes
Multiple Choice Quiz 1
Multiple Choice Quiz 2
Interactive Exercises
PowerPoint Presentation Chapter 13 (18524.0K)
Chapter 13
Flashcards
Internet Exercises
Interactive Exercises
More Resources
![]() Web Links
Web Links
www.kohler.com
www.kbb.com
www.ebay.com
www.newsweek.com
www.cheaptickets.com
www.orbitz.com
www.travelocity.com