
|
STEP 3: COLLECT
|
•
|
|
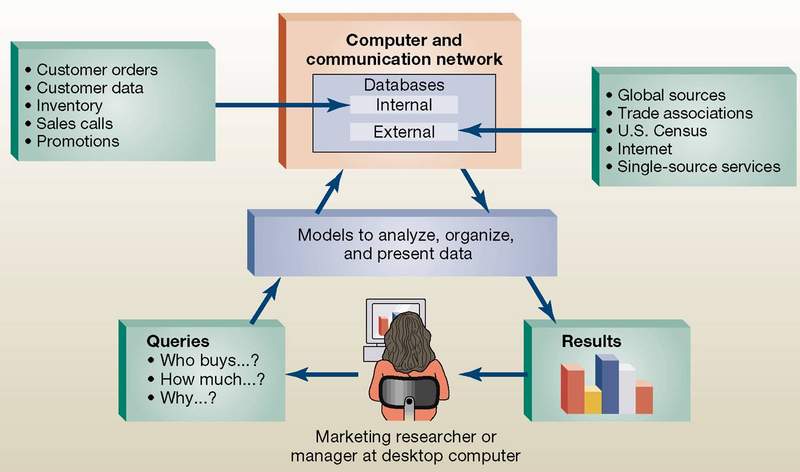
Information Technology |
|
Information
technology involves designing and managing computer
and communication networks to provide a system to satisfy an organization’s
needs for data storage, processing, and access.
|
|
Data Mining |
|
Data mining
is the extraction of hidden predictive information from large databases.
|
|
FIGURE 8-8 Product and brand drivers: factors that influence sales |

|
FIGURE 8-9 How marketing researchers and managers use information technology . . . |
|
STEP 4:
DEVELOP FINDINGS
|
|
|
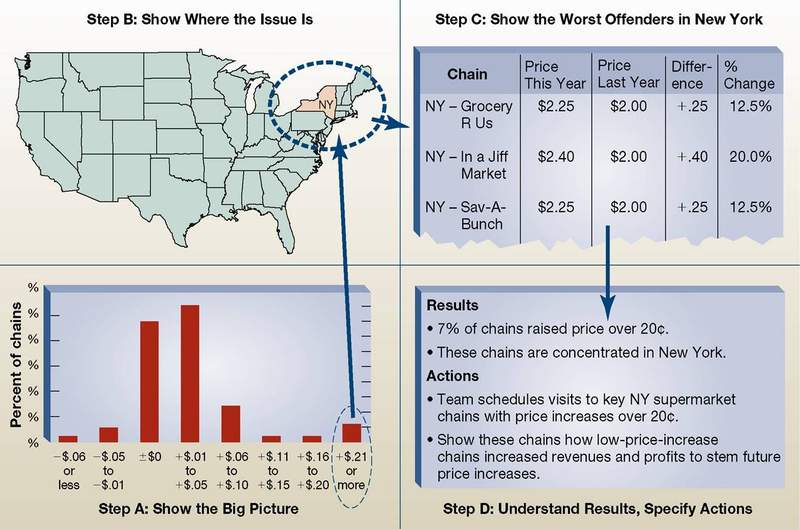
FIGURE 8-10 Converting data into marketing actions: What to do about supermarket chains . . . |
|
STEP 5: TAKE |
|
|
Concept Check |
|
1.
What does a marketing manager mean when she talks about a
sales driver?
A:
“Drivers” are the factors that influence buying decisions of a
household or organization and, hence, sales.
2.
How does data mining differ from traditional marketing
research?
A:
Traditional marketing research typically involves developing a
hypothesis about a driver and then collecting data; marketing researchers
than try to collect information to attempt to verify the truth of the
hypothesis. In contrast, data mining
is the extraction of hidden predictive information from large databases.
3.
In
the marketing research for Kellogg Pop Tarts, what is an example of (a)
a finding and (b) and action?
A:
Examples of a finding can be found in Figure 8-10, which summarizes
results—7% of chains raised
price over 20
cents; these chains are concentrated in New York.
Examples of an action from Figure 8-10 include “Team schedules visits
to key NY supermarket accounts with price increases over 20 cents.
|
|
MARKET AND
SALES FORECASTING |
•
Judgments of the Decision Maker
•
Surveys of Knowledgeable Groups
|
|
Market Potential |
|
Market
potential (or industry potential) refers to the
maximum total sales of a product by all firms to a segment during a
specified time period under specified environmental conditions and marketing
efforts of the firms.
|
|
Sales Forecast |
|
Sales forecast
(or company forecast) refers to the maximum total
sales of a product that a firm expects to sell during a specified time
period under specified environmental conditions and its own marketing
efforts.
|
|
Top-Down Forecast |
|
A
top-down forecast
involves subdividing an aggregate forecast into its principal components.
|
|
Buildup Forecast |
|
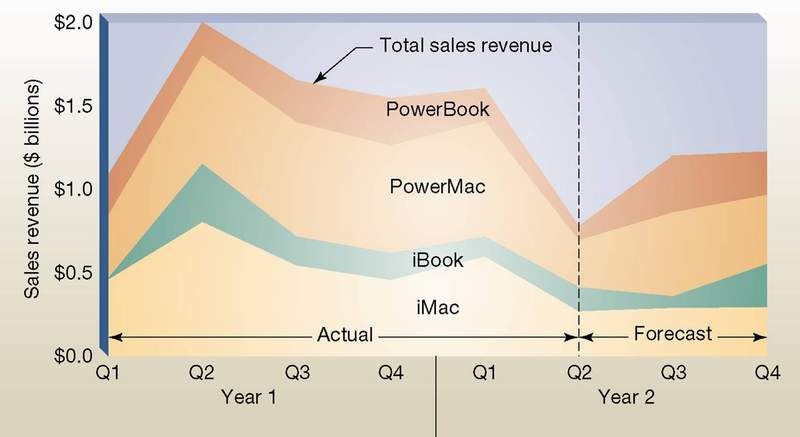
A
buildup forecast involves summing
the sales forecasts of each of the components to arrive at the total
forecast.
|
|
Direct Forecast |
|
A
direct forecast involves estimating
the value to be forecast without any intervening steps.
|
|
Lost-Horse Forecast |
|
A
lost-horse forecast involves starting
with the last known value of the item being forecast, listing the factors that
could affect the forecast, assessing whether they have a positive or negative
impact, and making the final forecast.
|
|
Survey
of Buyers’ |
|
A
survey of buyers’ intentions forecast
involves asking prospective customers whether they are likely to buy the
product during some future time periods.
|
|
Salesforce Survey Forecast |
|
A
salesforce survey forecast involves
asking the firm’s salespeople to estimate sales during a
coming period.
|
|
Jury of
Executive |
|
A
jury of executive opinion forecast
involves asking knowledgeable executives inside the firm about likely sales
for a coming period.
|
|
Survey of Experts Forecast |
|
A
survey of experts forecast involves
asking experts on a topic to make a judgment about some future event.
|
|
Trend Extrapolation |
|
Trend
extrapolation involves extending a pattern observed
in past data into the future.
|
|
FIGURE 8-11 Buildup approach to a two-quarter sales forecast for Apple Computer products |
|
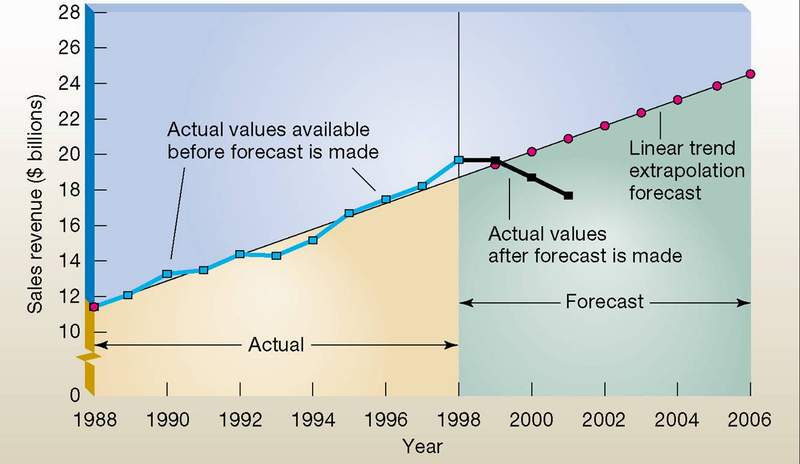
FIGURE 8-12 Linear trend extrapolation of sales revenues of Xerox . . . 1999 |
|
Concept Check |
|
1.
What is the difference between the top-down and
buildup approaches to forecasting sales?
A:
A top-down forecast involves subdividing an aggregate forecast into its
principal components.
A buildup forecast involves summing the sales
forecasts of each of the components to arrive at the total forecast.
2. How do you make a lost-horse forecast?
A:
Starting with the last known value of the item being forecast, Listing the
factors that could affect the forecast, assessing whether they have a
positive or negative impact, and making the final forecast.
3.
What is linear trend extrapolation?
A:
A linear trend extrapolation involves extending a pattern observed in
past data into the future. To draw a
trend line, plot the sales revenue data from past time periods, fit a
straight line between these points, and extend the line to future time
periods to give forecast values.
|
|
Chapter 8 - Summary |
|
|
News, Articles & Links
Quizzes
Multiple Choice Quiz 1
Multiple Choice Quiz 2
Interactive Exercises
PowerPoint Presentation Chapter 8 (20191.0K)
Chapter 8
Flashcards
Internet Exercises
Interactive Exercises
More Resources
![]() Web Links
Web Links
www.lordoftherings.net
www.fisherprice.com
www.lexisnexis.com
www.proquest.com
www.bloomberg.com
www.investors.com
www.dowjones.com
www.fisonline.com
www.stat-usa.gov
www.firstgov.gov
www.yahoo.com
www.oralb.com
www.wendys.com
www.worldopinion.com
www.fordconsultinggroup.com