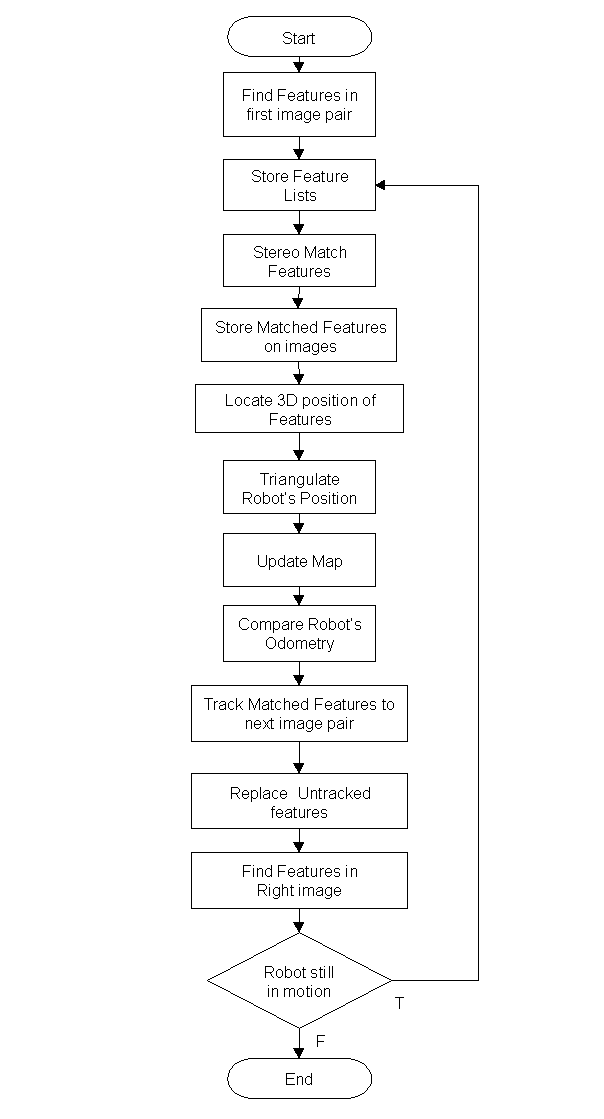
It then attempts to find 25 features in both images and stores them. Once they are stored, it proceeds to match features from the left image to the right image (stereo match). The procedure to stereo match features will be described later, now well focus on the general operation of the robot. The stereo matched features are stored and then used to locate their 3D position in the robots coordinate frame. These are added to the robots map. With this information, the robot can calculate its position and compare it with its odometry reading. At this point the robot moves to a new position and captures a new pair of stereo images, using the left image to track features its previous position. If some features are not successfully tracked to the next image, it replaces the lost features with new ones. The tracked and replaced features are used to stereo match the current image pair after finding 25 suitable features in the right image. Then the procedure repeats with the addition of updating the map with the replaced features. These are added to the map once they are referenced to the fixed world coordinate frame. The whole procedure is shown in Figure 5.
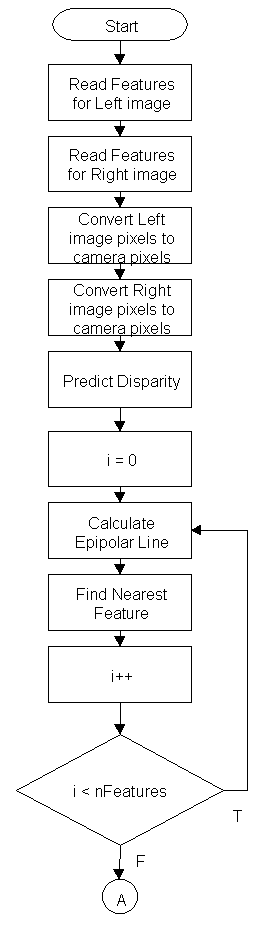
In order to make a good stereo match a prediction of the disparity from left to right image is used. This is approximation is determined with the distance moved by the robot. This value can be obtained from the robots odometry.
Then for each feature in the left image the distance from each right feature to the epipolar line is calculated. The list of feature distance is sorted in ascending order and then the features, which are further than an acceptable distance, filtered out. After a bit of experimentation the value of 20 was found to be sufficient. At that moment the distance between the left feature and the candidates in the right image is calculated. Next the feature with the lowest value of disparity but near a small range around the predicted disparity is chosen as the match.
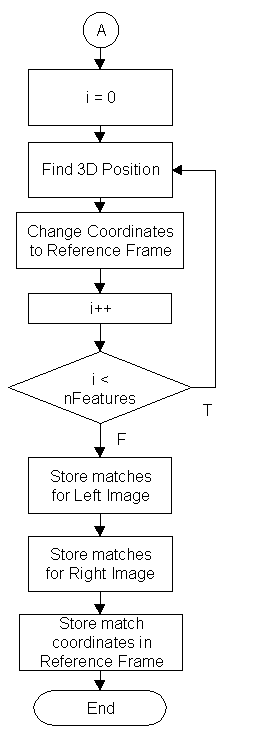
Once the matched features are obtained, their 3D position in the robots coordinate frame is calculated. This information is used together with the current estimation of the robots position to place the features in the fixed world coordinate frame.
An overview of the steps taken to find the stereo matches is shown in Figure 6.
Position was estimated by calculating the shift in 3D location of each
tracked feature. Therefore each tracked feature gives an estimate of the
robots shift. To minimize errors, outliers outside a distance of 40 cms.
of the estimates average were removed. Once the outliers have been filtered,
the average of the remaining estimates was calculated to give a better
solution. Section 4.6 will present the results at several stages of the
experiment.