If you spot any errors in here you can e-mail me to supply the correct information. Source is from the CIA World Fact Book - 1994.
Population for 1994
Total: 43,930,631 (July
1994 est.)
Population growth rate: 2.62% (1994 est.)
Birth rate: 33.58
births/1,000 population (1994 est.)
Death rate: 7.53
deaths/1,000 population (1994 est.)
Net migration rate: 0.16
migrant(s)/1,000 population (1994 est.)
Infant mortality rate: 47.1
deaths/1,000 live births (1994 est.)
Life expectancy at birth: total
population: 65.11 years male: 62.37 years female: 67.94 years
(1994 est.)
Total fertility rate: 4.37 children born/woman (1994 est.)
Nationality: noun: South
African(s) adjective: South African
Ethnic divisions: black
75.2%, white 13.6%, Colored 8.6%, Indian 2.6%
Religions: Christian 72%
(most whites and Coloreds and about 60% of blacks), Hindu 2% (60%
of Indians), traditional religion 20%, secular 5%, Muslim 1%
Literacy rate: 50%
Africans, 62% 'Coloureds', 69% Asians, 99% Whites (1990 WA), 43%
(1977 C. M. Brann). Information mainly from Voegelin and Voegelin
1977; Ruhlen 1987. Data accuracy estimate: B
Blind population: 62,000
(1982 WCE)
Deaf population: 12,100
(1986 Gallaudet University), deaf institutions in country: 43
Back to Top

Total area: 1,219,912 sq km
land area: 1,219,912 sq km comparative area: slightly less than
twice the size of Texas note: includes Prince Edward Islands
(Marion Island and Prince Edward Island)
Land boundaries: total
4,750 km, Botswana 1,840 km, Lesotho 909 km, Mozambique 491 km,
Namibia 855 km, Swaziland 430 km, Zimbabwe 225 km
Coastline: 2,798 km
Maritime claims:
continental shelf: 200-m depth or to depth of exploitation
exclusive fishing zone: 200 nm territorial sea: 12 nm
Back to Top
Overview:
The main strength of the economy lies in its rich mineral
resources, which provide two-thirds of exports. Economic
developments for the remainder of the 1990s will be driven
largely by the new government's attempts to improve black living
conditions and to set the country on an aggressive export-led
growth path. The shrinking economy in recent years has absorbed
less than 5% of the more than 300,000 workers entering the labor
force annually. Local economists estimate that the economy must
grow between 5% and 6% in real terms annually to absorb all of
the new entrants.
National product: GDP -
purchasing power equivalent - $171 billion (1993 est.)
National product real growth rate: 1.1% (1993 est.)
National product per capita: $4,000 (1993 est.)
Inflation rate (consumer prices): 9.7%
(1993 est.)
Unemployment rate: 50%
(1994 est.)
Budget: revenues: $26.3
billion expenditures: $34 billion, including capital expenditures
of $2.5 billion (FY94 est.)
Exports: $24.3
billion (f.o.b., 1993) commodities: gold 27%, other minerals and
metals 20-25%, food 5%, chemicals 3% partners: Italy, Japan, US,
Germany, UK, other EC countries, Hong Kong
Imports: $18.1 billion
(f.o.b., 1993) commodities: machinery 32%, transport equipment
15%, chemicals 11%, oil, textiles, scientific instruments
partners: Germany, US, Japan, UK, Italy
External debt: $17 billion
(1993 est.)
Industrial production: growth
rate NA%; accounts for about 40% of GDP
Electricity: capacity:
46,000,000 kW production: 180 billion kWh consumption per capita:
4,100 kWh (1991)
Industries: mining (world's
largest producer of platinum, gold, chromium), automobile
assembly, metalworking, machinery, textile, iron and steel,
chemical, fertilizer, foodstuffs
Agriculture: accounts for
about 5% of GDP and 30% of labor force; diversified agriculture,
with emphasis on livestock; products - cattle, poultry, sheep,
wool, milk, beef, corn, wheat, sugarcane, fruits, vegetables;
self-sufficient in food
Illicit drugs: Transshipment
center of heroin and cocaine; cocaine consumption on the rise
Economic aid: many aid
packages for the new government are still being prepared; current
aid pledges include US $600 million over 3 years; UK $150 million
over 3 years; Australia $21 million over 3 years
Currency: 1 rand (R) = 100
cents
Exchange rates: rand (R)
per US$1 - 3.4551 (March 1994), 3.2636 (1993), 2.8497 (1992),
2.7563 (1991), 2.5863 (1990), 2.6166 (1989)
Fiscal year: 1 April - 31
March
Back to Top
Railroads: 20,638 km route
distance total; 20,324 km of 1.067-meter gauge trackage (counts
double and multiple tracking as single track); 314 km of 610 mm
gauge; substantial electrification of 1.067 meter gauge
Highways: Total: 188,309 km
paved: 54,013 km unpaved: crushed stone, gravel, improved earth
134,296 km
Pipelines: Crude oil 931
km; petroleum products 1,748 km; natural gas 322 km
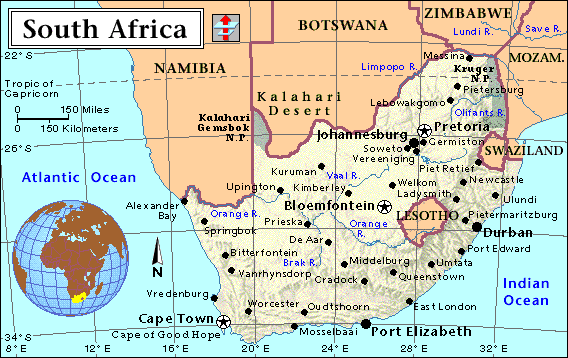
Ports: Durban, Cape Town,
Port Elizabeth, Richards Bay, Saldanha, Mosselbaai
Merchant marine: 5 ships
(1,000 GRT or over) totaling 213,273 GRT/201,043 DWT, container
4, vehicle carrier 1
Airports: Total: 886
usable: 718 with permanent-surface runways: 140 with runways over
3,659 m: 5 with runways 2,440-3,659 m: 10 with runways
1,220-2,439 m: 213
Telecommunications: The
system is the best developed, most modern, and has the highest
capacity in Africa; it consists of carrier-equipped open-wire
lines, coaxial cables, radio relay links, fiber optic cable, and
radiocommunication stations; key centers are Bloemfontein, Cape
Town, Durban, Johannesburg, Port Elizabeth, and Pretoria; over
4,500,000 telephones; broadcast stations - 14 AM, 286 FM, 67 TV;
1 submarine cable; satellite earth stations - 1 Indian Ocean
INTELSAT and 2 Atlantic Ocean INTELSAT (Two country wide cellular
phone networks are also in operation now, plus many more satelite
channels)
Back to Top
Gauteng | Northen Province | Mpumalanga
North-west
Province | Free State
| KwaZulu/Natal
Eastern Cape | Northen Cape | Western Cape
Back to Top
At the moment there are 11 (yes ELEVEN) official languages in use
in SA. Each province can choose a few of those languages to
cunduct its main provincial matters in. For instance Gauteng's
official languages are English, Afrikaans, Xhosa and Zulu.
The eleven oficial languages of the whole country are as
follows:
- Xhosa
- Zulu
- Afrikaans
- English
- Sotho (Northen and Southern)
- Tswana
- Sipedi
- Venda
- Ndebele
- Swati
- Tsonga
Other unoficial languages and dialects often
used in the South Africa:
- Birwa
- Chinese, Mandarin
- Fanagolo
- Fly Taal
- Gimsbok Nama
- Gujarati
- Hindi
- Korana
- Nama
- Ngamani
- Nghuki
- Oorlans
- Ronga
- Seroa
- South African Sign Language
- Swahili
- Swati
- Tamil
- Tswa
- Urdu
- Xam
- Xegwi
- Xiri
Back to Top