VERIFICATION of the

CORRELATION BETWEEN TRIBOELECTRIC
BROKEN BAG DETECTOR SIGNALS and a CONTINUOUS OPACITY MONITOR
on an EAF BAGHOUSE © 2002
authors:
Joseph C. Wesselman, Corporate Director of Environmental Affairs IPSCO Enterprises Inc.
Charles W. Askins, P.E., President AG Environmental Services, Inc.


Introduction

This report presents the results of continuing work begun in October 2000, comparing the output of a triboelectric broken bag detection system to a Continuous Opacity Monitor (COM). Both of which are installed on the Electric Arc Furnace/Ladle Metallurgy (EAF/LMF) Baghouse at the IPSCO Steel Inc. (IPSCO), Montpelier Works located in Muscatine, Iowa. A correlation between the devices was established, based upon dust introduction testing in November 2000. This correlation was statistically refined and the resulting correlation function was used to predict triboelectric signals associated with the output of the COM during normal EAF operations. Actual triboelectric signal output was compared to the predicted values to determine the validity of the correlation function.

A detailed discussion of the work associated with the development of the initial correlation functions is available in the paper, Comparison of a Continuous Opacity Monitor and Method 9 Observations to Broken Bag Detector Signals on an EAF Baghouse.

Background

The present New Source Performance Standard (NSPS) for an EAF requires the installation of a COM on any baghouse that uses a single stack. The EAF shop at Montpelier Works uses a negative pressure, pulse jet cleaned baghouse with a single stack. In accordance with the NSPS requirements, a COM was installed on the stack. The NSPS visible emission standard applied to the EAF stack is a maximum of 3% opacity averaged over six (6) minutes.

NSPS Revision
USEPA conducted a review of the performance specification, PS-1, for the COM in 1999, in response to the publication in 1998 of the ASTM Standard D 6216-98, Standard Practice for Opacity Monitor Manufacturers to Certify Conformance with Design and Performance Specifications. The ASTM standard established a minimum confidence level of 10% opacity for the COM, presenting a problem for USEPA when requiring the use of a COM where the applicable standard is below this confidence level. The ASTM Standard confirmed concerns raised by the Steel Industry over the last number of years, and USEPA assured the industry that they would address these concerns in the revision to the PS-1. After applying extensive technical latitude, USEPA was able to rationalize a confidence level of 7% opacity when republishing the PS-1, however, they failed to address the appropriateness of using a COM where the applicable standard is below the confidence level, such as the 3% EAF Standard. Upon publication of the revised PS-1 Standard, USEPA was sued by several steel trade associations. In an effort to resolve the suit USEPA is considering revisions to the NSPS for Electric Arc Furnaces. One revision under consideration is to allow for alternatives to the COM, including use of broken bag detection (BBD) systems, for assuring compliance with the baghouse maintenance standard, originally the purpose of the 3% opacity standard. At the writing of this paper however, there have been no formal proposal published in the Federal Register.

Application of the COM and BBD at IPSCO, Montpelier Works
The COM has a documented problem measuring to the 3% opacity standard, and has a history of indicating false opacities above the standard. Bag penetration by sparks in the negative pressure, pulse jet cleaned baghouse has been a continuing maintenance problem, and the COM has shown itself to be ineffective as a tool for identifying the compartment location of failed bags.

To provide operators with a more proactive and useful tool, IPSCO investigated the feasibility of using a BBD system. After a review of BBD system technologies, a triboelectric based system was selected. It is generally recognized that when applied as a maintenance tool for detection of broken bag locations, the following considerations apply to current technologies that are available and/or required by regulation.

1. A COM is required for a single stack, negative pressure baghouse. In this application, the COM is of limited usefulness on a Multiple Compartment Baghouse for identifying the location of broken bags. When more than one compartment has broken bags, the device is useless.
2. The COM is not typically required for positive pressure baghouses because of the multiple vents or ridge vent exhaust configuration on this types of baghouse. If a COM is installed on a positive pressure baghouse, it has the same limited usefulness for identifying the location of broken bags.
3. The BBD technology can be configured in the multiple compartment baghouse to allow operators to quickly identify the compartment containing broken bags. The system is equally effective in identification when multiple compartments contain broken bags at the same time.

Given the operating advantage of the BBD systems, and because of the lower levels of particulate able to be detected by the triboelectric technology, IPSCO applied to USEPA for the use of alternative monitoring technology on the EAF/LMF baghouse. The use of a triboelectric broken bag detection system was proposed for replacement of the COM presently installed on the stack. The proposed technology change was conditionally approved by USEPA, with the condition that IPSCO run a forty five (45) day comparison to establish the relative relationship of the triboelectric signals to opacity as measured by the COM. This comparison was performed during the period of September 2000 through November 2000. This comparison work was reported to USEPA, Region 7 (Region 7), and is the same data1 presented at the AISE annual convention in 2001.

The report presented to Region 7 included both the study information on the dust introduction testing, and evaluation of normal EAF operations during the 45 day period. After review of the report, Region 7 reversed its conditional approval, and requested additional data from IPSCO to support correlation between the triboelectric broken bag detector (BBD) signals and the COM signals at and below the 3% opacity standard.

This new request asked for a "correlation" (a higher standard of relationship) than the "comparison" originally requested and demonstrated by the 45 day study. The correlation request also ignored the fact that the COM, unable to produce reliable data below 10% opacity , was being set as the control instrument for identifying a relationship. Scientifically, the Region 7 request asked for development of a mathematical relationship between two instruments in a region where one of the instruments (COM) is known to have poor sensitivity while the other (BBD) is know to have high sensitivity. Further complicating the data analysis, Region 7 set the poor sensitivity instrument (COM) as the control for the regression analysis.

Nevertheless, IPSCO agreed to review a period of operating data that included five (5) days of normal EAF operations in August 2001 to determine if a correlation could be demonstrated between the two devices at levels of opacity below the 3% standard.

Prior to discussing the verification study it is necessary to review information from the original study that establishes the basis for the correlation of opacity to triboelectric signals below 3% opacity. This information includes:

1. A discussion of opacity and how it applies to the EAF baghouse
2. A discussion of how a COM measures opacity
3. A discussion of how triboelectric BBD technology works
4. A description of the baghouse facility at Montpelier Works
5. Explanation of how the initial regression relationships were established through surrogate dust injection tests
6. Explanation of how the triboelectric BBD system is configured to monitor and alarm at Montpelier Works

Opacity Related to EAF Baghouses

Fundamental compliance with the particulate standard for EAF emissions is based upon the particulate mass emissions from the baghouse. Since continuous monitoring of mass emissions is a practical impossibility for fume control systems, the use of surrogate measurements has been adopted to characterize the particulate emissions from the baghouse. The surrogate measurement adopted by USEPA in the NSPS for the EAF baghouse is relative opacity. Opacity is the quantification of the amount of light lost when passing through an emission plume, and is characterized by percent (%) loss of light. The opacity measurement range starts with 0%, being no loss, and 100%, being complete loss of light, or fully opaque.

USEPA established a standard method of visual evaluation for particulate emissions that uses a trained human observer to establish opacity of exhaust plumes. This procedure is found in 40 CFR 60 as Reference Method 9 (USEPA Method 9). The requirement for visual opacity measurements using USEPA Method 9 has been established in the EAF - NSPS to allow for operators and regulators to monitor the EAF baghouse compliance with the particulate mass emission standard.

The measurement of opacity (by either Method 9 or a COM) and the measurement of triboelectric change are surrogate measurements for the mass emissions from the baghouse, and measure the amount of particulate present in an exhaust gas stream. Neither system measures particulate mass emissions.

COM System Method of Measurement

The measurement of opacity can be done using an instrument such as a COM. The COM uses the same basic principle as VE observations, measuring the loss of light associated with passage of a light though an exhaust plume. In the case of a COM, the source of light is a beam that is directed across a duct or stack striking a mirror on the opposite side of the duct. The mirror is aligned to reflect the light back to the light source. The instrument then measures the reduction in light intensity after this double path length, and calculates the loss as relative opacity.

The COM measurement of opacity is based upon the principle that particles present in the gas stream will effect the amount of light returning. This is based upon the fact that particles have the inherent and variable characteristics of light absorbence, refraction or reflection. These light effecting characteristics are associated with the size, shape and structure of the respective particle, as well as the quantity of particles present in the gas stream. These factors have nothing to do with the density or mass of the respective particle. The COM presumes that all light lost is associated with particles in the gas stream.

Since there is neither a correlation to the gas flow volume nor the concentration of particulate present, the mass emission associated with the gas flow cannot be measured by the COM.

Opacity, whether measured by Method 9 or a COM, is a qualitative surrogate for the quantity of particulate matter being emitted. The standard for opacity in the EAF - NSPS is < 3% opacity averaged over 6 minutes of continuous readings. The human eye can distinguish opacity to the level of 5% increments, and the minimum detectable change recorded by the human eye is 5%. Therefore the EAF-NSPS of < 3% opacity represents a no visible emission standard. The COM is able to measure opacity in fractions of a percent, however as noted previously, ASTM2 concluded that a COM is accurate only to the level of 10% opacity.

Triboelectric Broken Bag Detector System

The measurement principle of the triboelectric BBD system is based upon measuring the small changes in electrical charge of an energized probe placed within the exhaust gas stream. The probe is a stainless steel or other metallic material rod that is energized with a DC electrical voltage. The particulate present in the gas stream strikes the probe, and the strikes act to change the electric field of the probe. This mechanism is similar to the release of static electricity that has been accumulated in a person’s clothing or skin surface. The small changes in the electric field associated with the particle impacts are measured in pico-amps. These pico-amp changes are the measurements that quantify the triboelectric signal.

The triboelectric signal is an analog output that is displayed as a percent of scale. The impact of no particles is measured as 0%, with the relative increase of particle strikes measured up to 100% of the scale.

Because of the nature of the measurement mechanism, the Triboelectric BBD can detect particles as small as 2 microns in diameter . These particles are invisible to the COM and the human eye.

Similar to the COM, the particle characteristics of size, shape and structure of the respective particle, as well as the quantity of particles present in the gas stream effect the relative change in triboelectric signal. Once again, these factors have nothing to do with directly measuring the density or mass of the respective particle.

EAF/LMF Baghouse Description

Both a COM and the BBD system are installed on the EAF/LMF Baghouse at the IPSCO Montpelier Works. The EAF/LMF Baghouse is a negative pressure, pulse jet cleaning baghouse that was installed for fume control of an EAF and LMF melt shop subject to the New Performance Standards (NSPS) for EAF’s. The negative pressure baghouse has a stack exhaust, and as such, is obligated to install and operate a COM on the stack.

The EAF is a twin shell DC electrode furnace, and is initially designed to produce 164 tons/hour (tph) of steel. At this base design rating, the EAF baghouse is sized and permitted to operate using twenty four (24) compartments, with one compartment off line for service and/or cleaning during operations. The baghouse (under a phased PSD Permit) has been permitted and built to allow for the EAF to operate at a production rate of 200 tph. At the 200 tph production rate the baghouse system is designed to operate with twenty eight (28) compartments, with one compartment off line for service and/or cleaning during operations.

The surrogate particulate introduction testing was done on the baghouse during the initial study work in November 2000. Figure 1-1 illustrates the arrangement of the baghouse, stack and respective COM and BBD locations.

Figure 1-1
EAF Baghouse Compartment Configuration
COM & Broken Bag Detector Locations
Surrogate Particulate Introduction

To quantify the relationship of the COM opacity to the BBD signals it was necessary to introduce particulate into the gas stream leaving the compartments to generate comparison points with enough separation to allow for regression of the data. To accomplish this, it was necessary to introduce a particulate that was similar in size and chemical nature to the EAF dust. A commercial grade of iron oxide (Fe2O3) was selected as the surrogate particulate. EAF dust is principally iron oxide with traces of other metals found in the scrap charged to the furnace.

Particulate Size Distribution

Samples of the commercial grade of Fe2O3 and EAF dust collected from the baghouse were submitted for particle size analysis at an independent laboratory. The mean particle size of the Fe2O3 is 1.857 µm, and the mean particle size of the EAF dust is 1.818 µm. The particle size distribution is summarized in Table 1.1.

Table 1.1
Particle Size Distribution Summary
Particulate 10% 25% 50% 75% 90%
EAF dust, µm <1.235 <1.581 <1.874 <2.107 <2.276
Fe2O3, µm <1.022 <1.328 <1.780 <2.346 <2.819


The iron oxide used as a surrogate particulate for the EAF dust had a particle size distribution similar to the EAF dust. This particle size range is representative of the size range of particles in the exhaust from an EAF baghouse that had penetrations in the filter bag fabric. Therefore, it is reasonable to expect that the response of both instrument systems would be similar to that associated with the actual escape of EAF dust from broken bags.

Initial Study Correlation of COM Opacity to Triboelectric Signals

The surrogate particulate testing was conducted on November 16, 2000. The probe data for the triboelectric signals was plotted against the COM data. The COM opacity to the triboelectric signals (A-1, A-2 probes) for the four tests on November 16 are plotted as both logarithmic and linear regression curves in Chart 1.1. The COM data is percent (%) relative opacity, and the BBD signals are percent (%) of scale.

Chart 1.1
Regression of COM Opacity to Triboelectric Signals, 11/16/00


The COM data points are one (1) minute averages of the COM continuous opacity output signal. The triboelectric signals are also one (1) minute average data from that system output

The respective regression curve formulae for the Triboelectric signal comparison to the COM opacity signals (Chart 1.1) with the associated R2 values are as follows:

Test #1 Probe A-1 to COM: y = 1.878x + 22.485 R2 = 0.4054
y = 24.205Ln(x) - 7.1213 R2 = 0.5782
Test #2 Probe A-1 to COM: y = 0.7932x + 31.156 R2 = 0.3311
y = 22.549Ln(x) - 13.203 R2 = 0.7056
Test #3 Probe A-2 to COM: y = 1.4231x + 8.8582 R2 = 0.8854
y = 21.934Ln(x) - 17.881 R2 = 0.9282
Test #4 Probe A-2 to COM: y = 1.8411x + 13.226 R2 = 0.7561
y = 24.875Ln(x) - 17.229 R2 = 0.9070
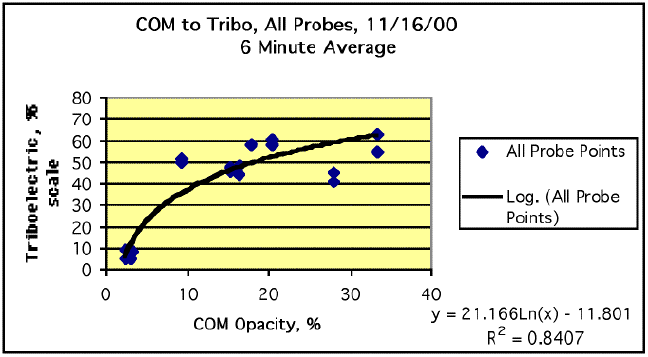
x = COM Opacity, %
y = Triboelectric Signal, % scale


Generally, the R2 values (an R2 value = 1.0 is a perfect correlation) for the regressions are much higher for the logarithmic formulae than for the linear formulae.

Compliance with the 3% opacity standard is based upon a six (6) minute average of opacities measured or observed during the 6 minute interval. Comparison of the COM and VE data to the Triboelectric signals, using a 6 minute average provides a different statistical population of points for comparison. The data averaged over 6 minutes for the respective instrument or method diminishes some of the swings measured on an instantaneous basis. Both the COM and the BBD instruments make measurements on a frequency of two (2) times per second. Using the measurements for all of the probes, averaged over 6 minutes, the regression of Triboelectric BBD signals to the COM signals produces the curve and formula presented in Chart 1.2. All of the points are based upon real time measurements.

Chart 1.2
Regression of 6 Minute Averaged COM and Triboelectric Measurements


The logarithmic regression of the data produces an equation with an R2 value exceeding 84%, indicating a very significant correlation.

Given this high R2 regression formula, it appears that COM readings have a logarithmic relationship to the BBD signals. The logarithmic relationship across the range of 0% to 100% opacity makes sense in the light of several known factors about the systems. These factors are:

- The relationship of Opacity (particulate) in air is a logarithmic relationship as established by the Beer-Lambert Law (light penetration in a fluid). As emissions increase (the quantity of mass increases), opacity can never exceed 100%.
- The Triboelectric BBD system is more of a particle counter than a COM, and though both are measuring surrogate parameters for mass emissions, the particle counter is closer to a measurement of particles (and associated mass). Thereby a logarithmic relationship could be expected between them, based upon the Beer-Lambert Law.
- The triboelectric BBD system programming can be set to focus upon lower versus higher levels of particulate passing the probe. In the case of the EAF where basically the standard is no visual emissions (< 3% opacity), the triboelectric BBD system focus is directed towards the low concentrations of particulate.
- Therefore it can be expected that the relationship of opacity to triboelectric BBD signals is more linear at opacities below 40%. This is the area of performance where the COM is measuring in the mid to lower range of its span, while the BBD is measuring near its mid to upper span range.

Configuration of Present BBD System

Given the understanding of the linear regression relationship at that time (December 2000), the data was correlated using the opacities below 40% to establish ranges for operating the BBD system. The regression formula for each of the probe groups can provide a basis for calculating an approximate triboelectric signal that is equivalent to 3% opacity. Using a linear regression for the opacities below 40% gives a correlation between the triboelectric BBD signals to opacity, whether it is opacity measured by COM or VE observations. The linear regression curves for the respective probe points are summarized as follows:

Probe B-2 y = 1.479x + 18.723
Probe A-2 y = 1.562 x + 14.806
Probe B-1 y = 1.0083 x + 31.33
Probe A-1 y = 0.71393 x + 31.735
Where: x = COM opacity, %
y = Triboelectric signal, % of scale


It is important to understand that the signal from the respective plenums groups, A-1, B-1 and A-2, B-2 are similar, but are somewhat different. This is to be expected since each plenum has a baseline triboelectric characteristic that is somewhat different because the respective baghouse compartments provide a slightly different baseline particulate load when the EAF is operating. This similarity with difference is evidenced by the linear regression formulae. The opacity multiplier for the A-1, B-1 probes is approximately 1.0 while the multiplier for the A-2, B-2 is approximately 1.5. The constant for the A-1, B-1 probes is about 31 while the constant for the A-2, B-2 probes is about 16.

Recognizing that the triboelectric signals include both visible and invisible particles, an alarm range equivalent to 3% opacity was selected as indicated below for the respective probe groups, and is applicable when using the scale factor of 1500 pico-amps.

Therefore, the respective ranges became:

Probes Groups: A-1, B-1 A-2, B-2
Normal Operating Range: 0% to 29% 0% to 24%
Caution Range: 30% to 37% 25% to 29%
Alarm Range: > 38% > 30%